Table of Contents
ToggleDatta’s Sales Dashboard: A Comprehensive Power BI Sales Performance Analysis
🔹 Project Summary – Power BI Sales Dashboard
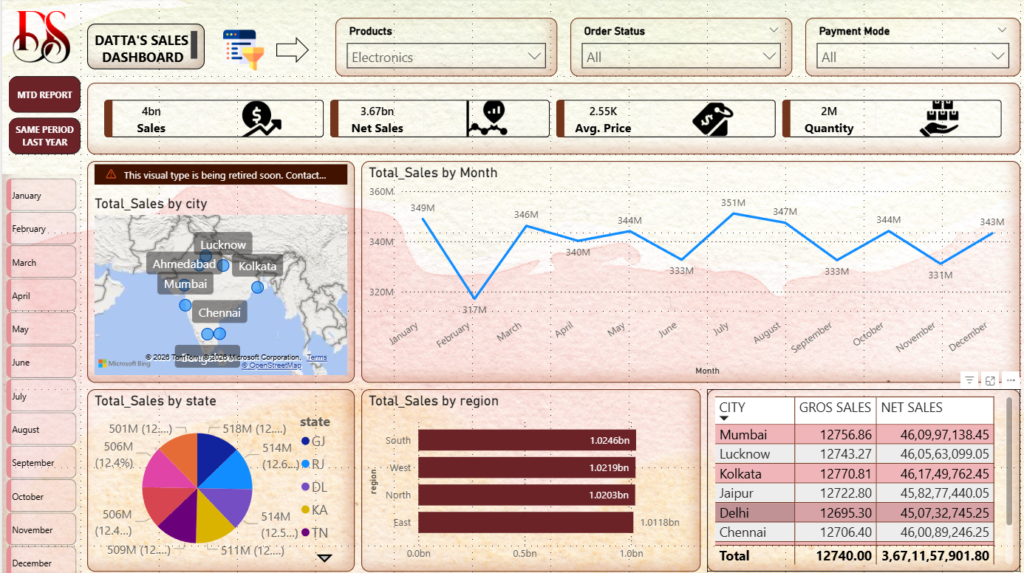
This interactive Sales Performance Dashboard is developed using Microsoft Power BI to analyze electronics sales data across time, regions, states, and cities. I designed a clean data model, created calculated KPIs (Sales, Net Sales, Average Price, Quantity), and used dynamic slicers and visuals to enable real-time business insights.
The dashboard helps businesses track monthly trends, identify top-performing locations, compare regional performance, and make data-driven decisions faster. Its interactive filters allow stakeholders to drill down instantly without technical knowledge, making it highly useful for management reporting, sales strategy, and performance monitoring.
This project demonstrates my ability to transform raw data into meaningful insights and deliver professional BI solutions suitable for real-world business use.
If you want, I can:
Make it more sales-oriented (for freelancing)
Make it simpler (for non-technical clients)
Customize it for Upwork / Fiverr / LinkedIn portfolio