Dashboard Showcase
Real-world analytics platforms engineered for high-stakes decision making. Filter by industry or stack.
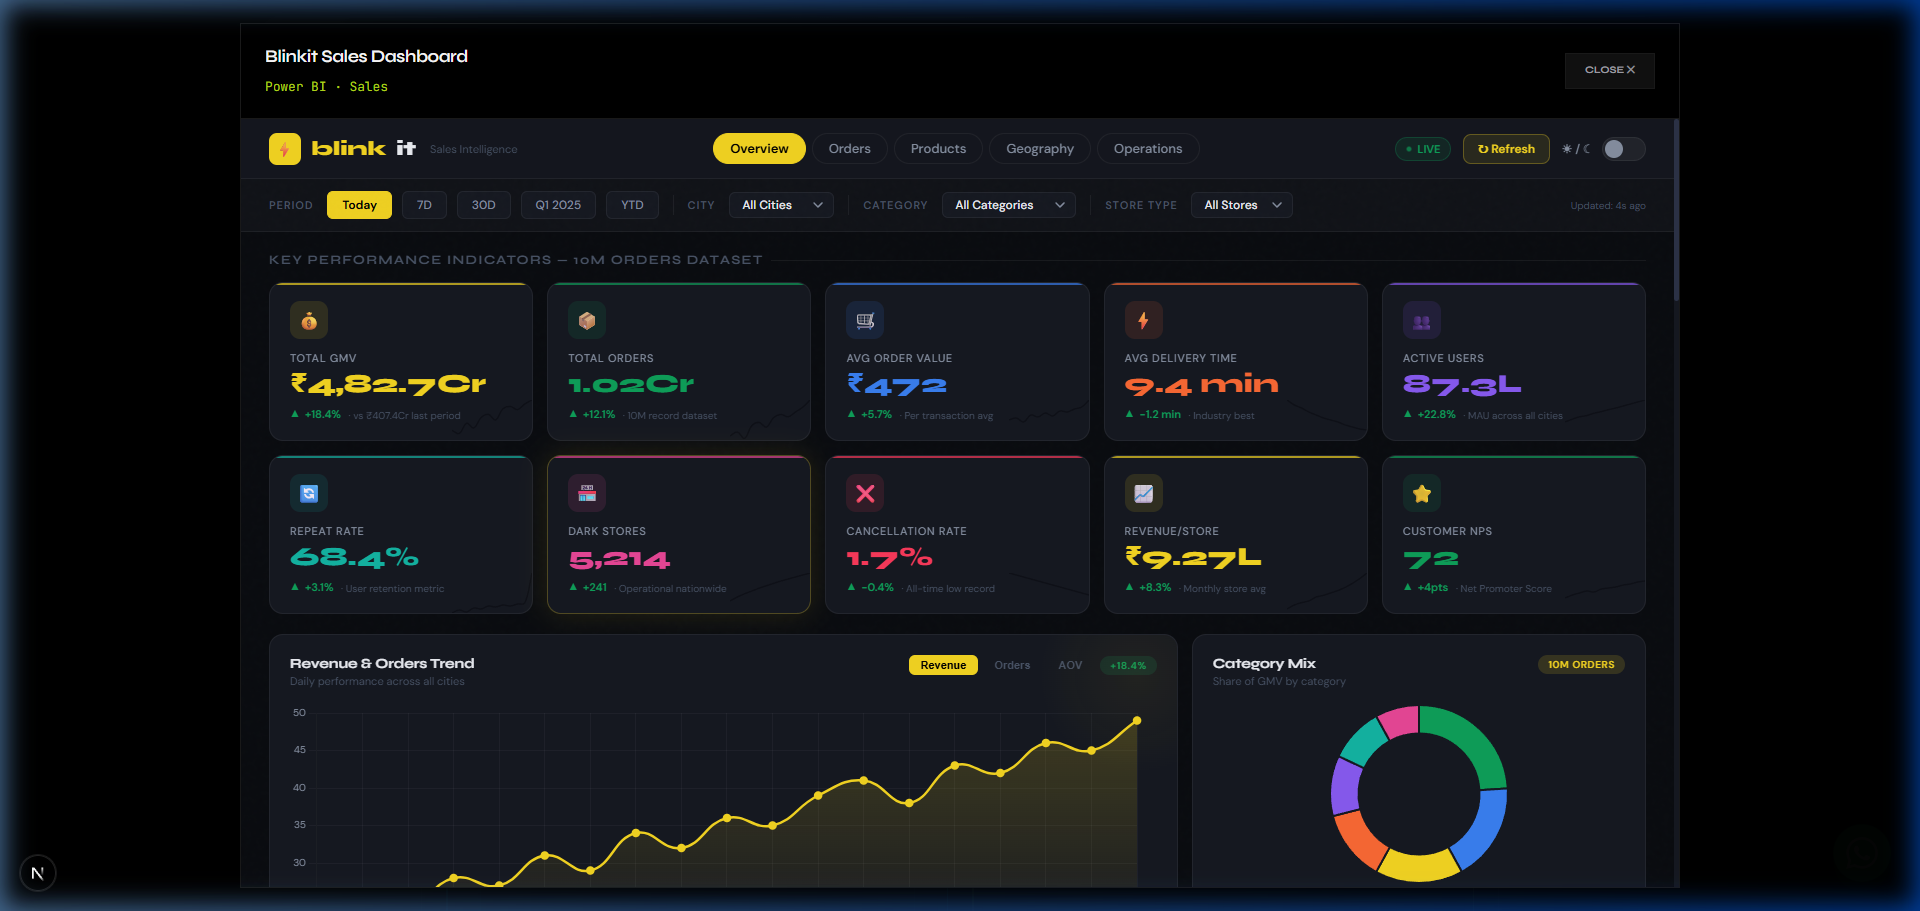
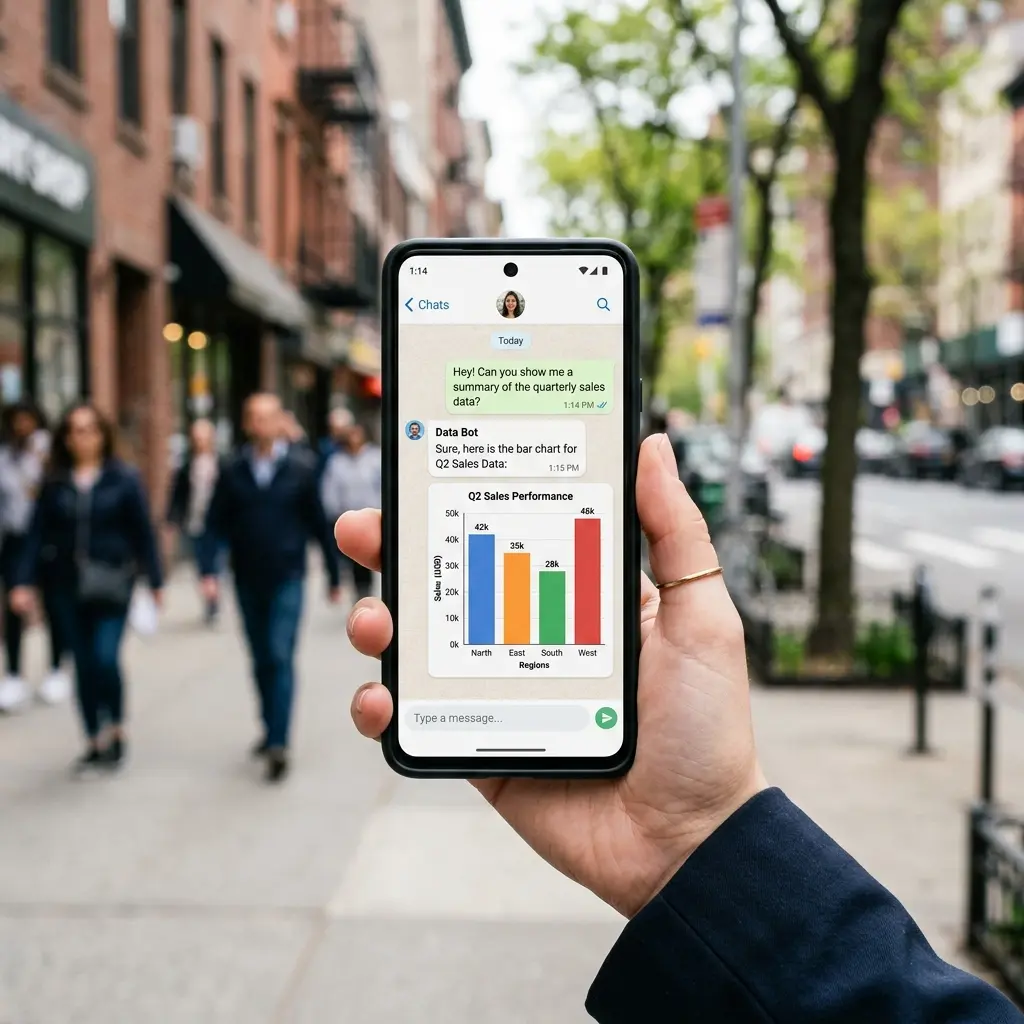
Blinkit Sales Dashboard
Comprehensive Blinkit sales performance and quick commerce analytics dashboard.
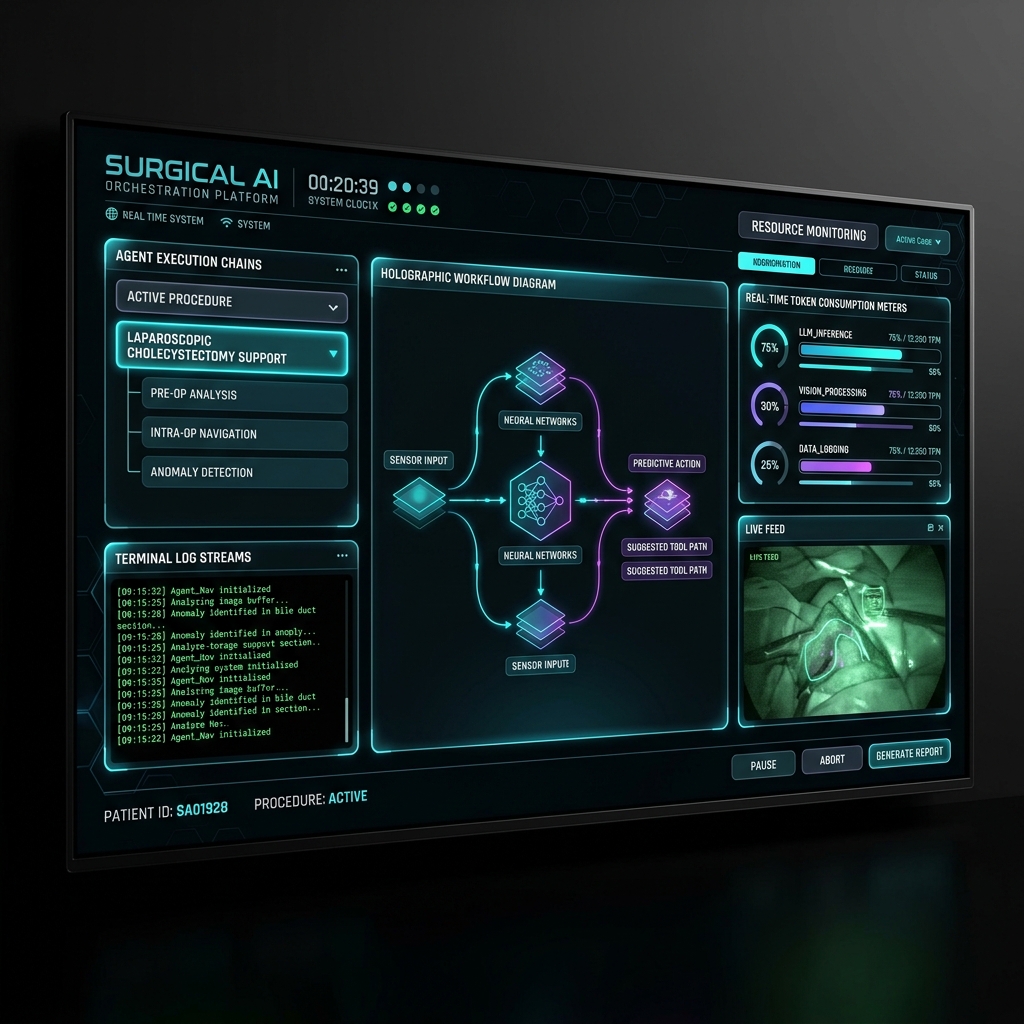
Surgical AI Workspace
Enterprise-grade AI workflow infrastructure for creators. Monitor intelligent execution chains and scale AI operations.
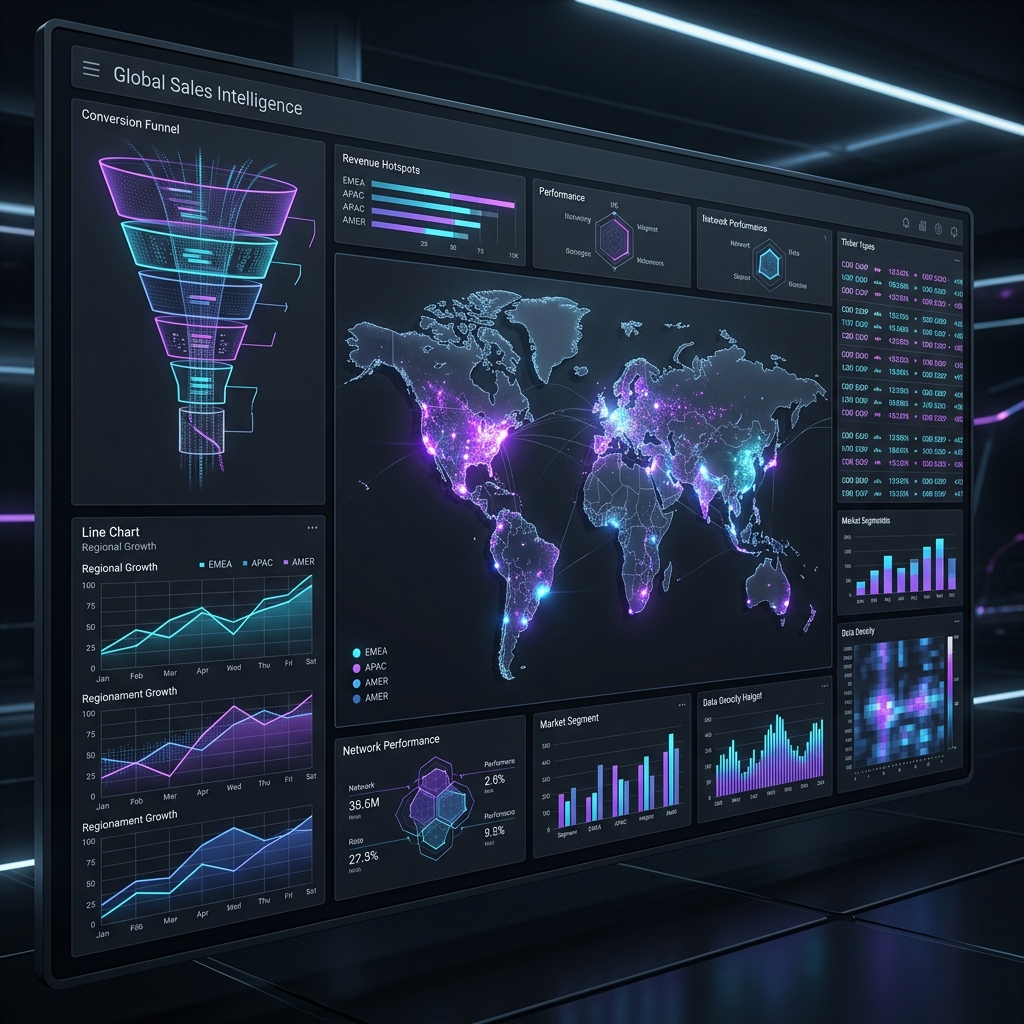
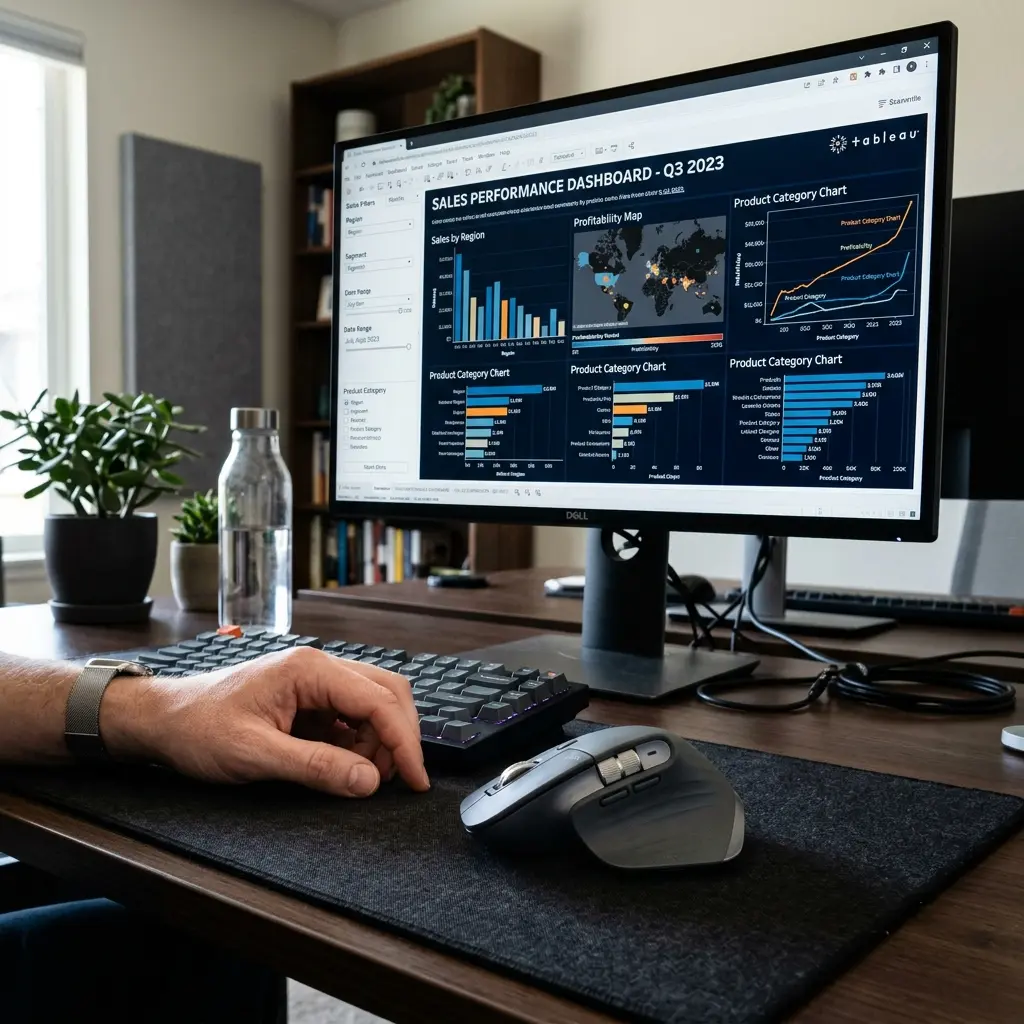
Global Sales Intelligence
Real-time global revenue monitoring with market penetration and conversion funnel analysis.
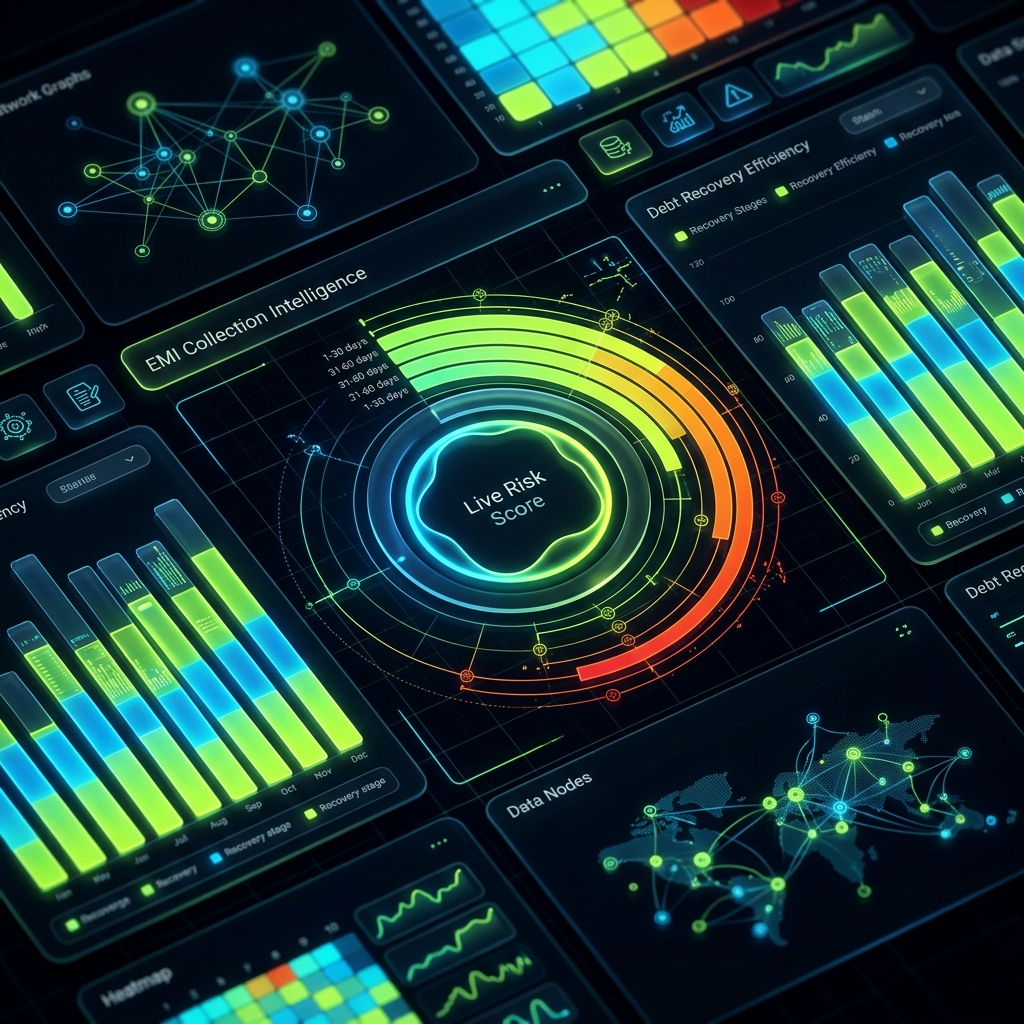
EMI Collection Intelligence
Next-gen collection infrastructure with real-time risk assessment, aging bucket analysis, and automated channel tracking.
Revenue Intelligence
SQL & Power BI MoM forecasting model displaying revenue streams, conversion drivers, and run-rate variance.
Interactive Demo
Live embedded BI experience showcasing interactive parameters, advanced level-of-detail queries, and custom tooltips.

Global Sales KPI Tracker
Real-time tracking of $12M+ in annual revenue with region/product/rep drilldown and YoY trend forecasting.
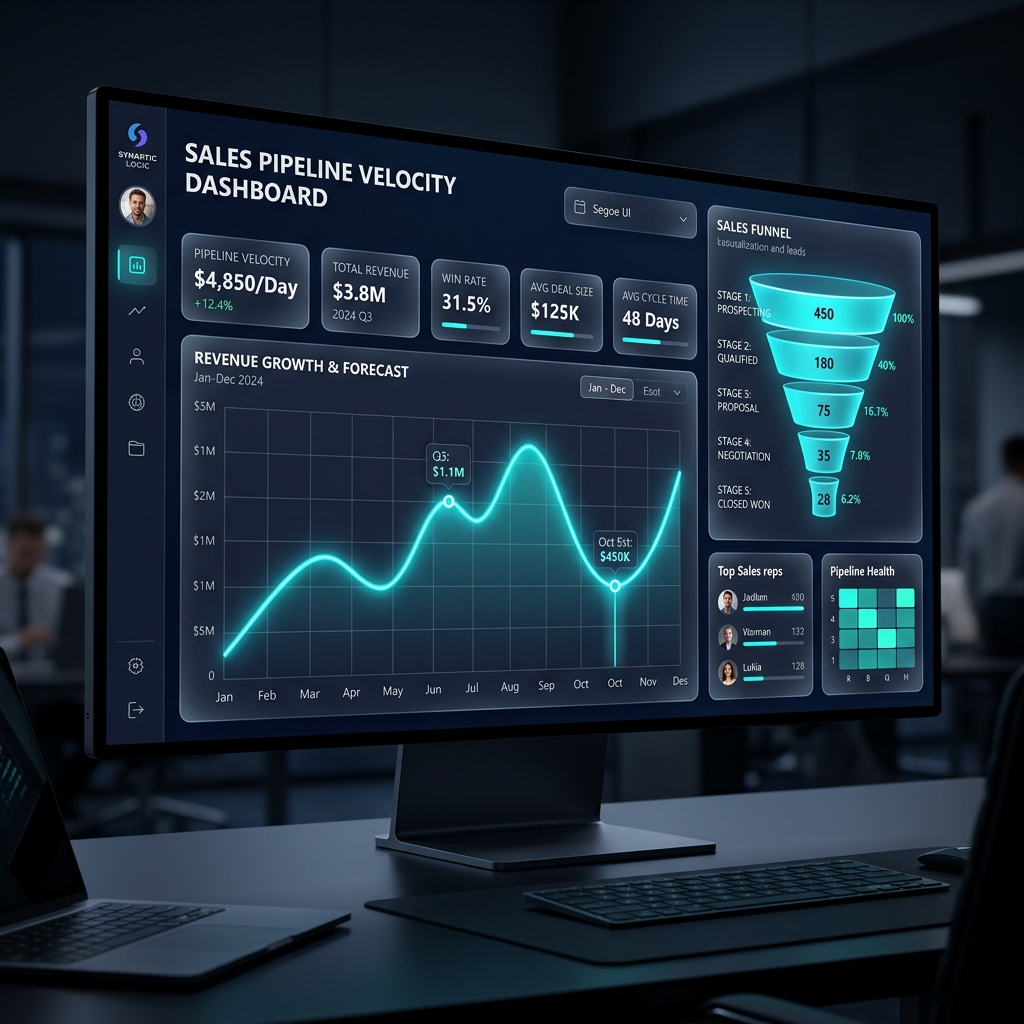
Sales Pipeline Velocity
Analysis of deal movement through the funnel, identifying bottlenecks and predicting quarterly closure rates.
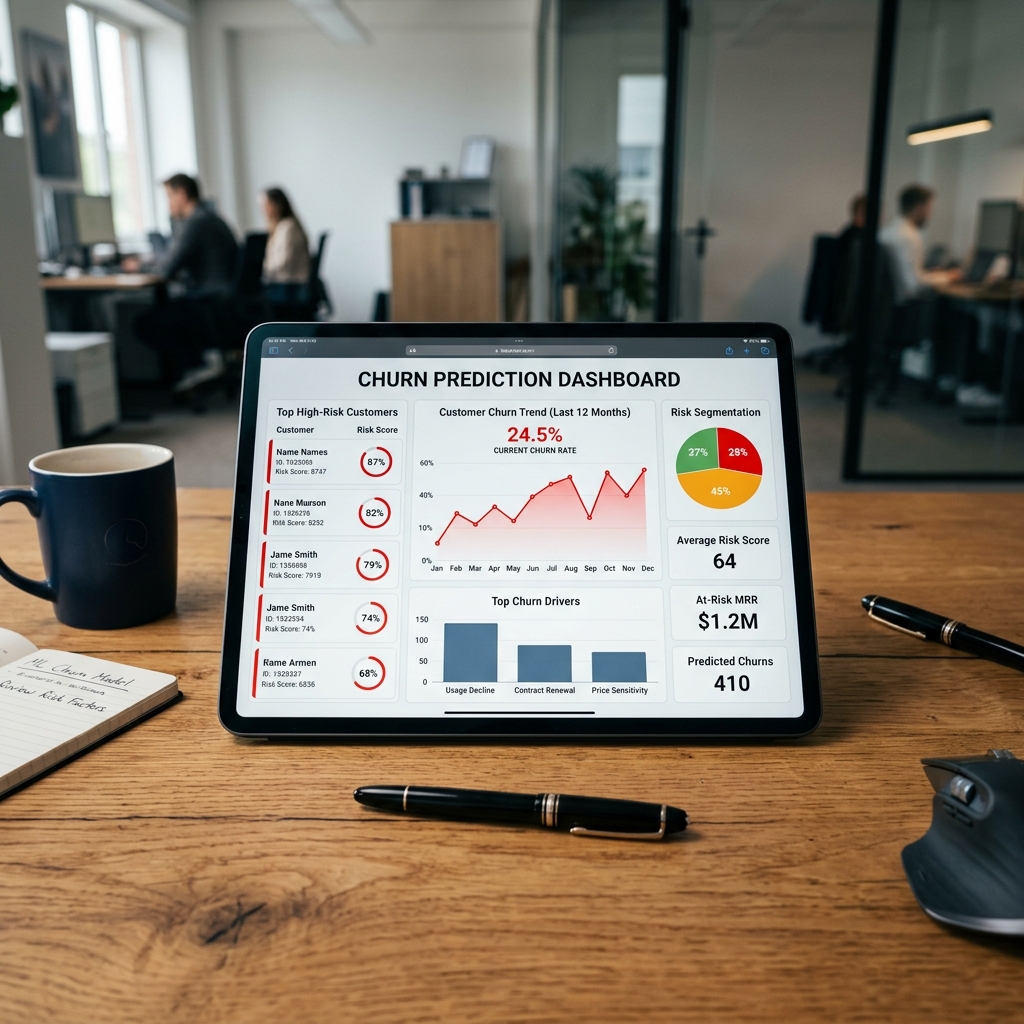
Customer Churn Prediction
ML-driven churn risk assessment integrated with Tableau for proactive account management and retention.
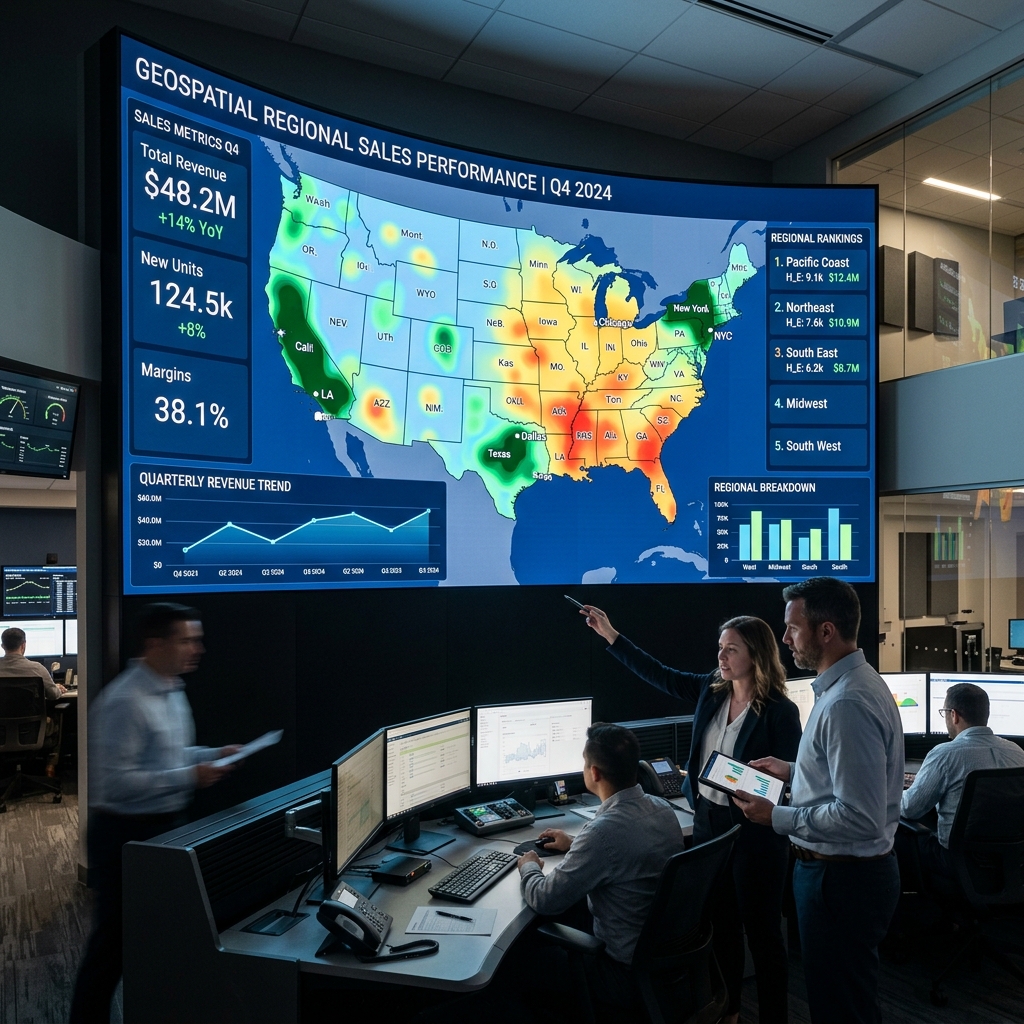
Regional Sales Performance
Geospatial analysis of sales performance across 50 states, correlated with local economic indicators.

Supply Chain Performance
End-to-end supply chain visibility — inventory, supplier SLA, logistics cost and demand forecasting.

Warehouse Throughput Monitor
Real-time monitoring of warehouse efficiency, picker performance, and order-to-shipment latency.

Predictive Maintenance Log
IoT sensor data analysis to predict equipment failure before it occurs, reducing unplanned downtime.
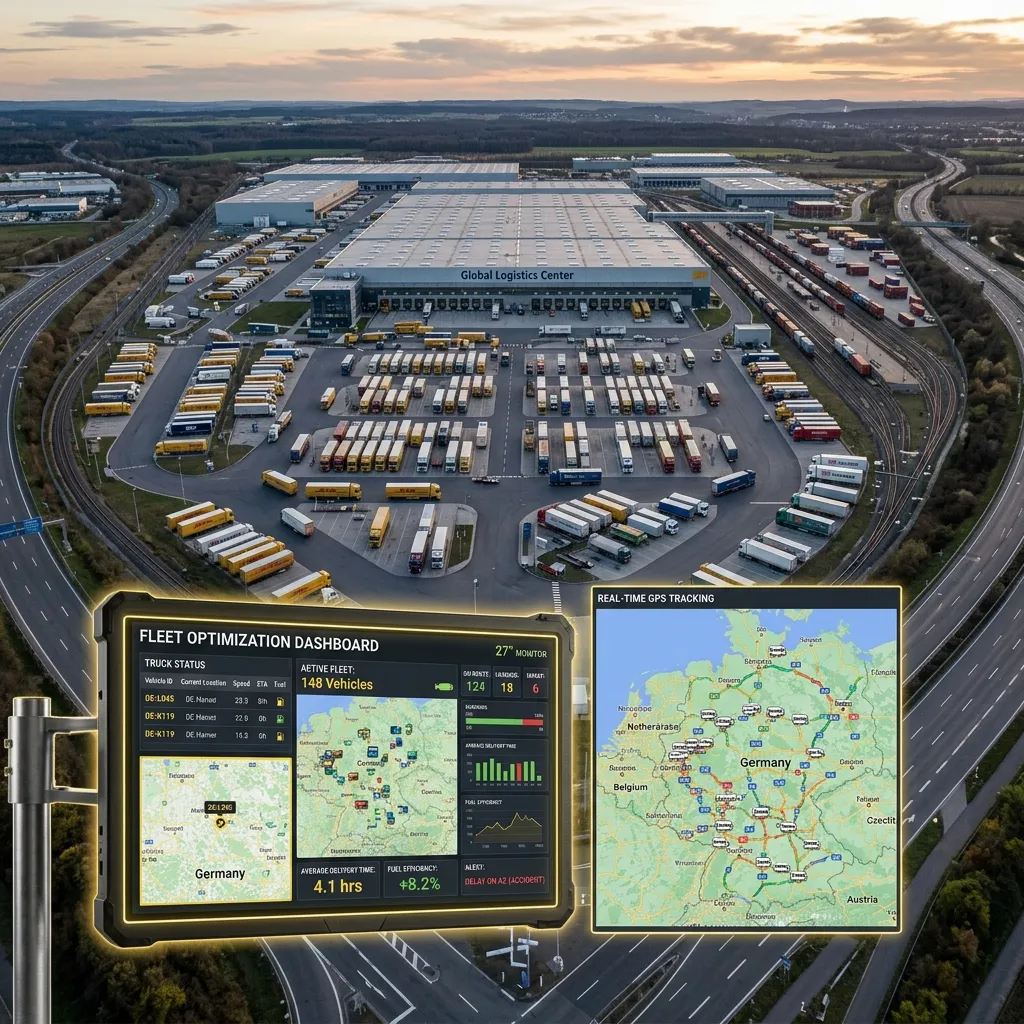
Fleet Logistics Optimization
Route optimization and fuel efficiency tracking for a 500-vehicle fleet across international borders.

HR Workforce Analytics
Attrition prediction, headcount planning, performance distribution, and diversity metrics.
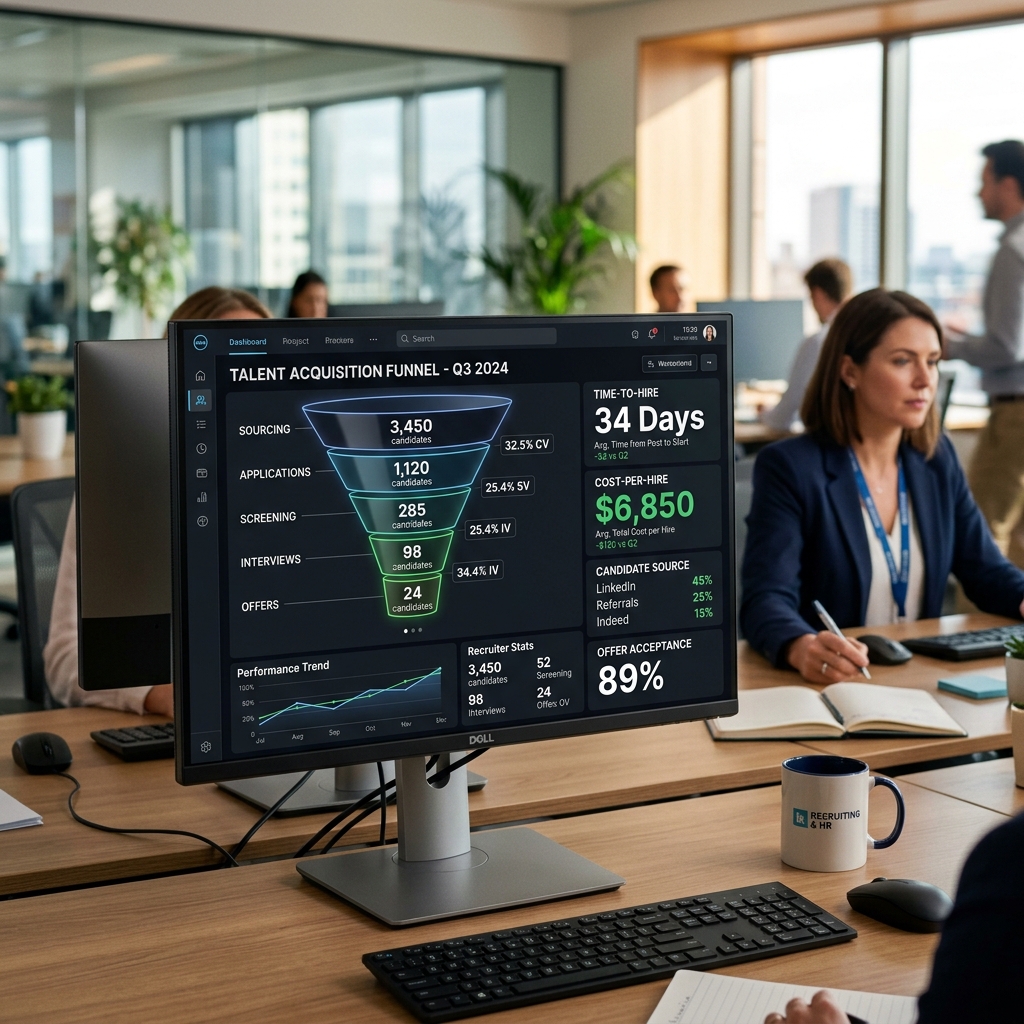
Talent Acquisition Funnel
Tracking recruitment efficiency, time-to-hire, and cost-per-hire across multiple sourcing channels.

Employee Performance Matrix
Automated 9-box grid for succession planning and performance vs. potential analysis.

Workplace Diversity Pulse
Real-time D&I reporting, ensuring compliance with global standards and tracking equity benchmarks.
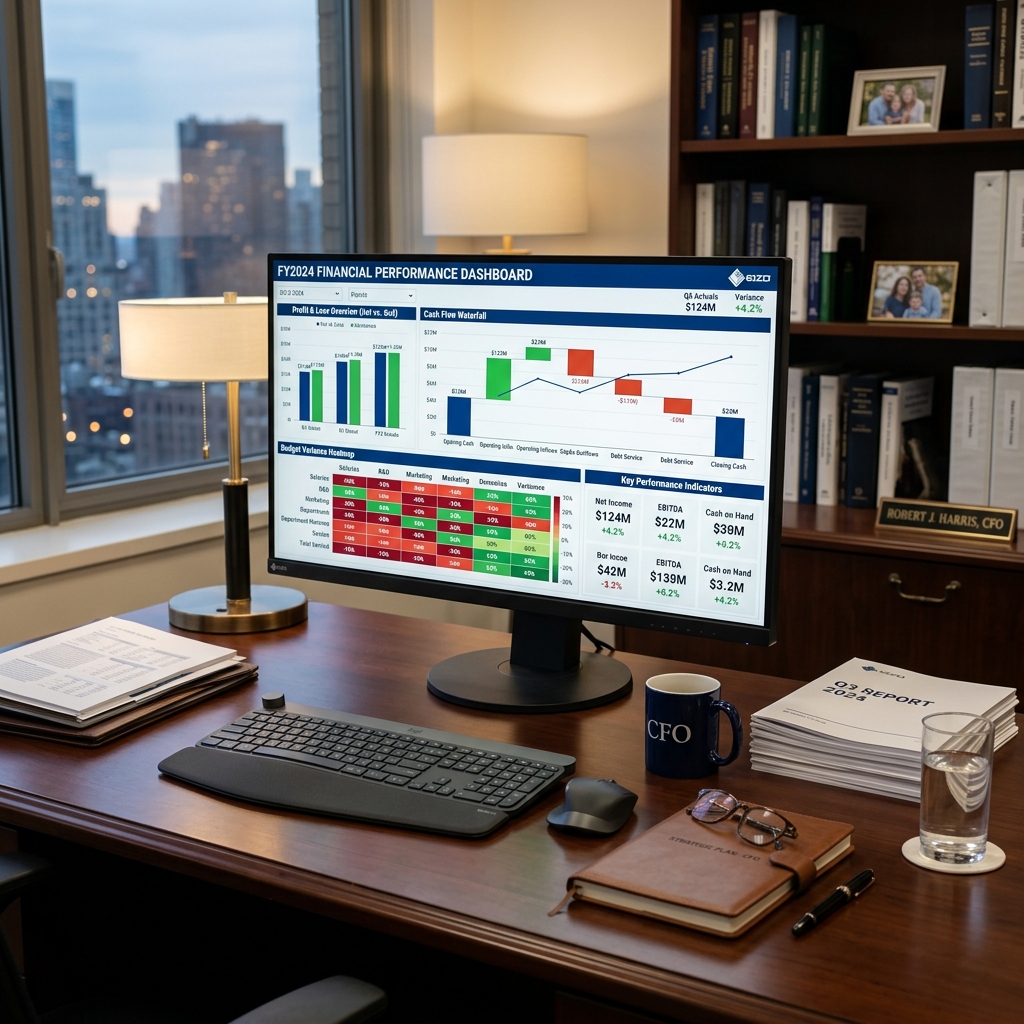
Financial P&L Dashboard
Board-ready P&L, cash flow waterfall, budget variance heatmap, and departmental cost breakdown.

Cash Flow Forecasting
12-month rolling cash flow forecast with multiple sensitivity analysis scenarios for executive planning.

SaaS Unit Economics
Real-time LTV/CAC, MRR movements, and cohort-based retention analysis for high-growth startups.
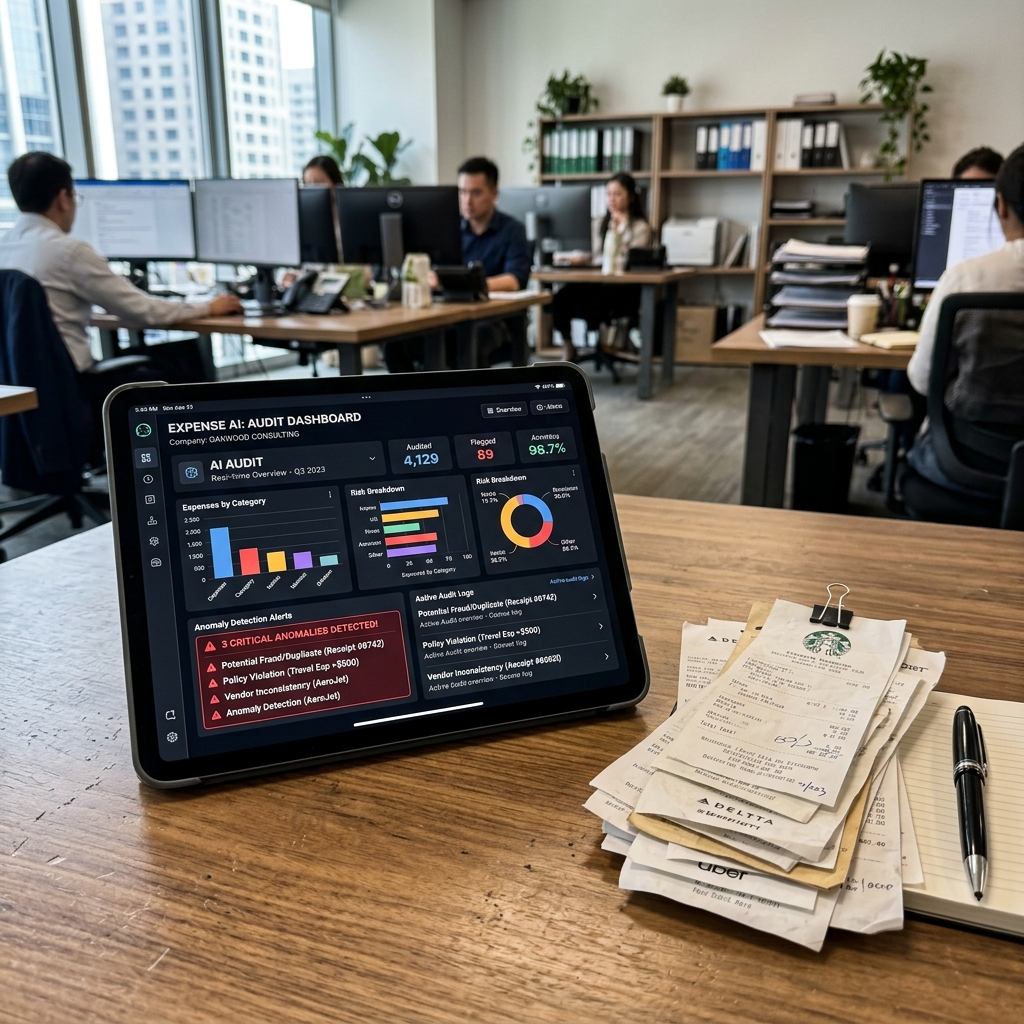
Expense Audit & Control
AI-powered anomaly detection in corporate expenses, identifying potential fraud or waste instantly.
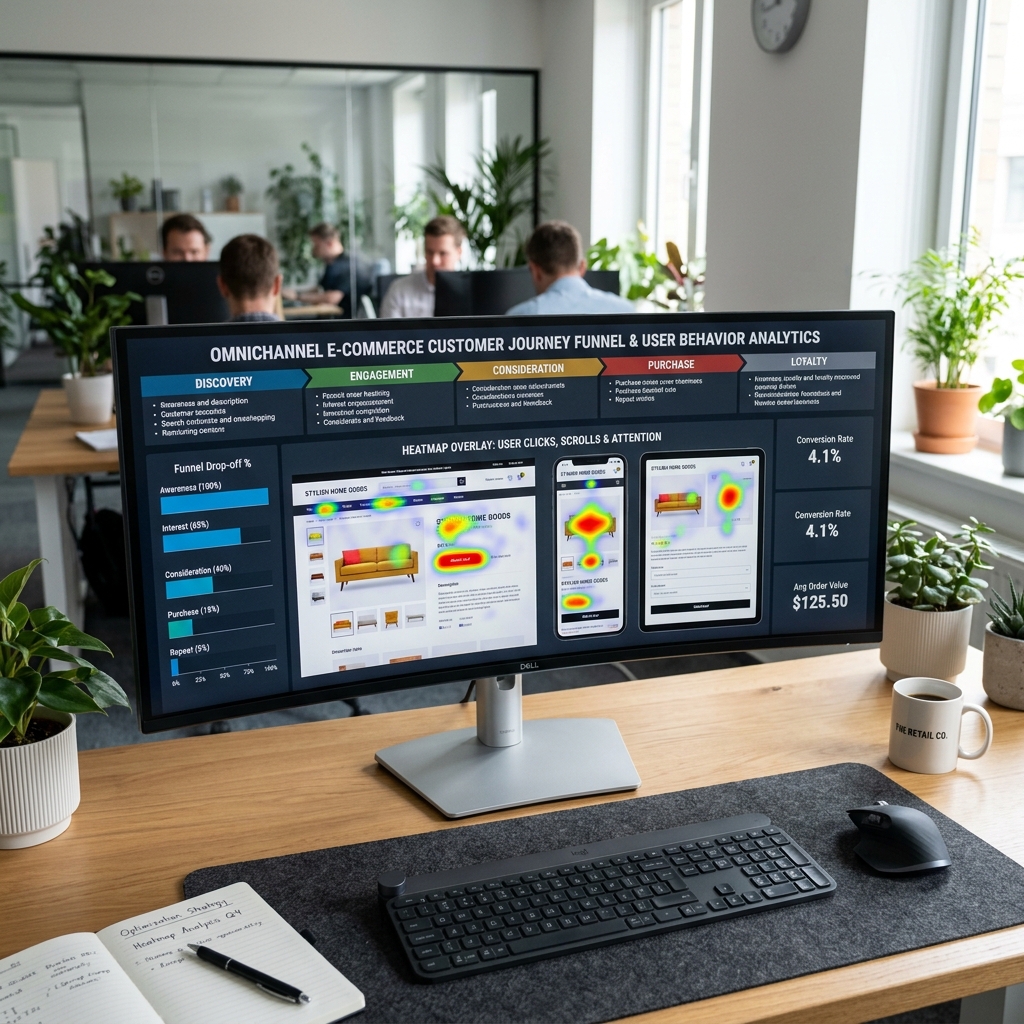
E-Commerce Customer Journey
Omnichannel attribution, customer lifetime value cohorts, funnel analysis, and campaign ROI tracking.

Marketing Campaign Analytics
Multi-channel campaign performance, A/B test results, audience segmentation, and real-time spend tracking.
Social Media Sentiment Engine
Real-time sentiment analysis of brand mentions across Twitter, Reddit, and LinkedIn using NLP.

SEO Performance Master
Comprehensive SEO health tracking, keyword rankings, backlink profiles, and organic traffic growth.

Executive Sales Overview
Modern executive-level summary featuring top-level sales, profit, and customer KPIs with quarterly comparisons.
Executive Sales Strategy
Sophisticated strategic dashboard designed for board-level decision-making with deep profitability insights.

Supply Chain & Logistics
Dedicated logistics-focused dashboard highlighting shipping performance and regional distribution efficiency.
Corporate Expense Audit
High-authority financial dashboard showcasing employee expense tracking and departmental budget management.

Super Sample Superstore
A world-famous, visually distinct dashboard using advanced custom formatting and technical design standards.