The Challenge
Stakeholders lacked a unified, interactive platform to explore business KPIs across different departments and timeframes.
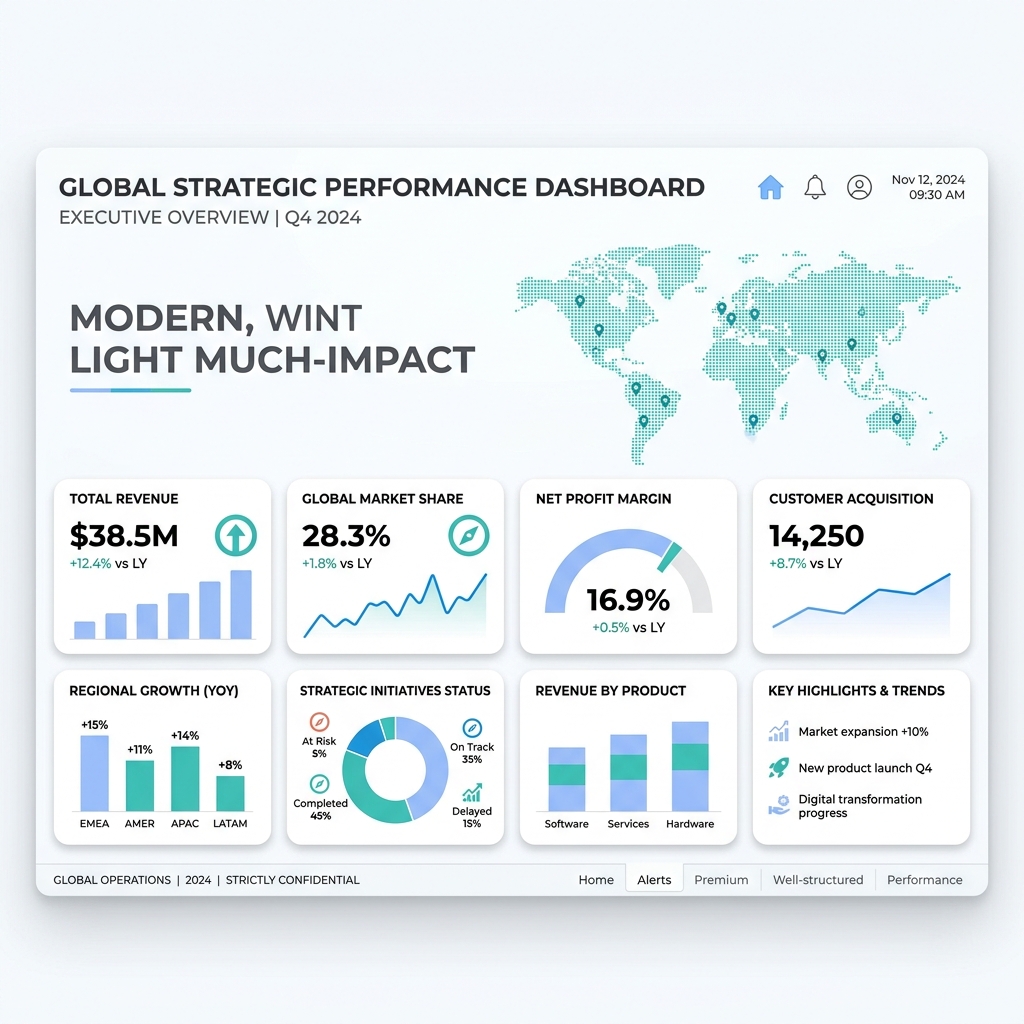
A comprehensive business discovery dashboard designed for exploring high-level KPIs and underlying data trends.
Stakeholders lacked a unified, interactive platform to explore business KPIs across different departments and timeframes.
Engineered a multi-layered discovery dashboard in Power BI that allows users to drill down from high-level metrics to granular row-level data.
Explore the high-fidelity implementation and architectural logic of the Dynamic Business Insights Explorer development environment.
The sequential process followed to ensure architectural integrity and delivery excellence.
Requirement gathering and technical feasibility audits.
Structural design and integration of core microservices.
Agile development cycles and real-time integration testing.
Production release and automated staging environment validation.
Designed with a focus on high data density and accessibility. The interface utilizes a fluid grid system to ensure seamless performance across enterprise environments.
Built using industry-standard protocols to ensure scalability. Every module is optimized for fast load times and real-time data integrity.