Aura Capital & FinTech GroupExecutive Performance & Commercial Sales Dashboard
Enterprise multi-sheet commercial intelligence model with quota attainment, dynamic cross-tabulations, and 1,036 certified transactions. Explore authentic screenshots of each worksheet below, or download the master spreadsheet workbook.
Workbook Sheet Screenshots
Click any sheet tab below to preview the exact spreadsheet reports created in Microsoft Excel
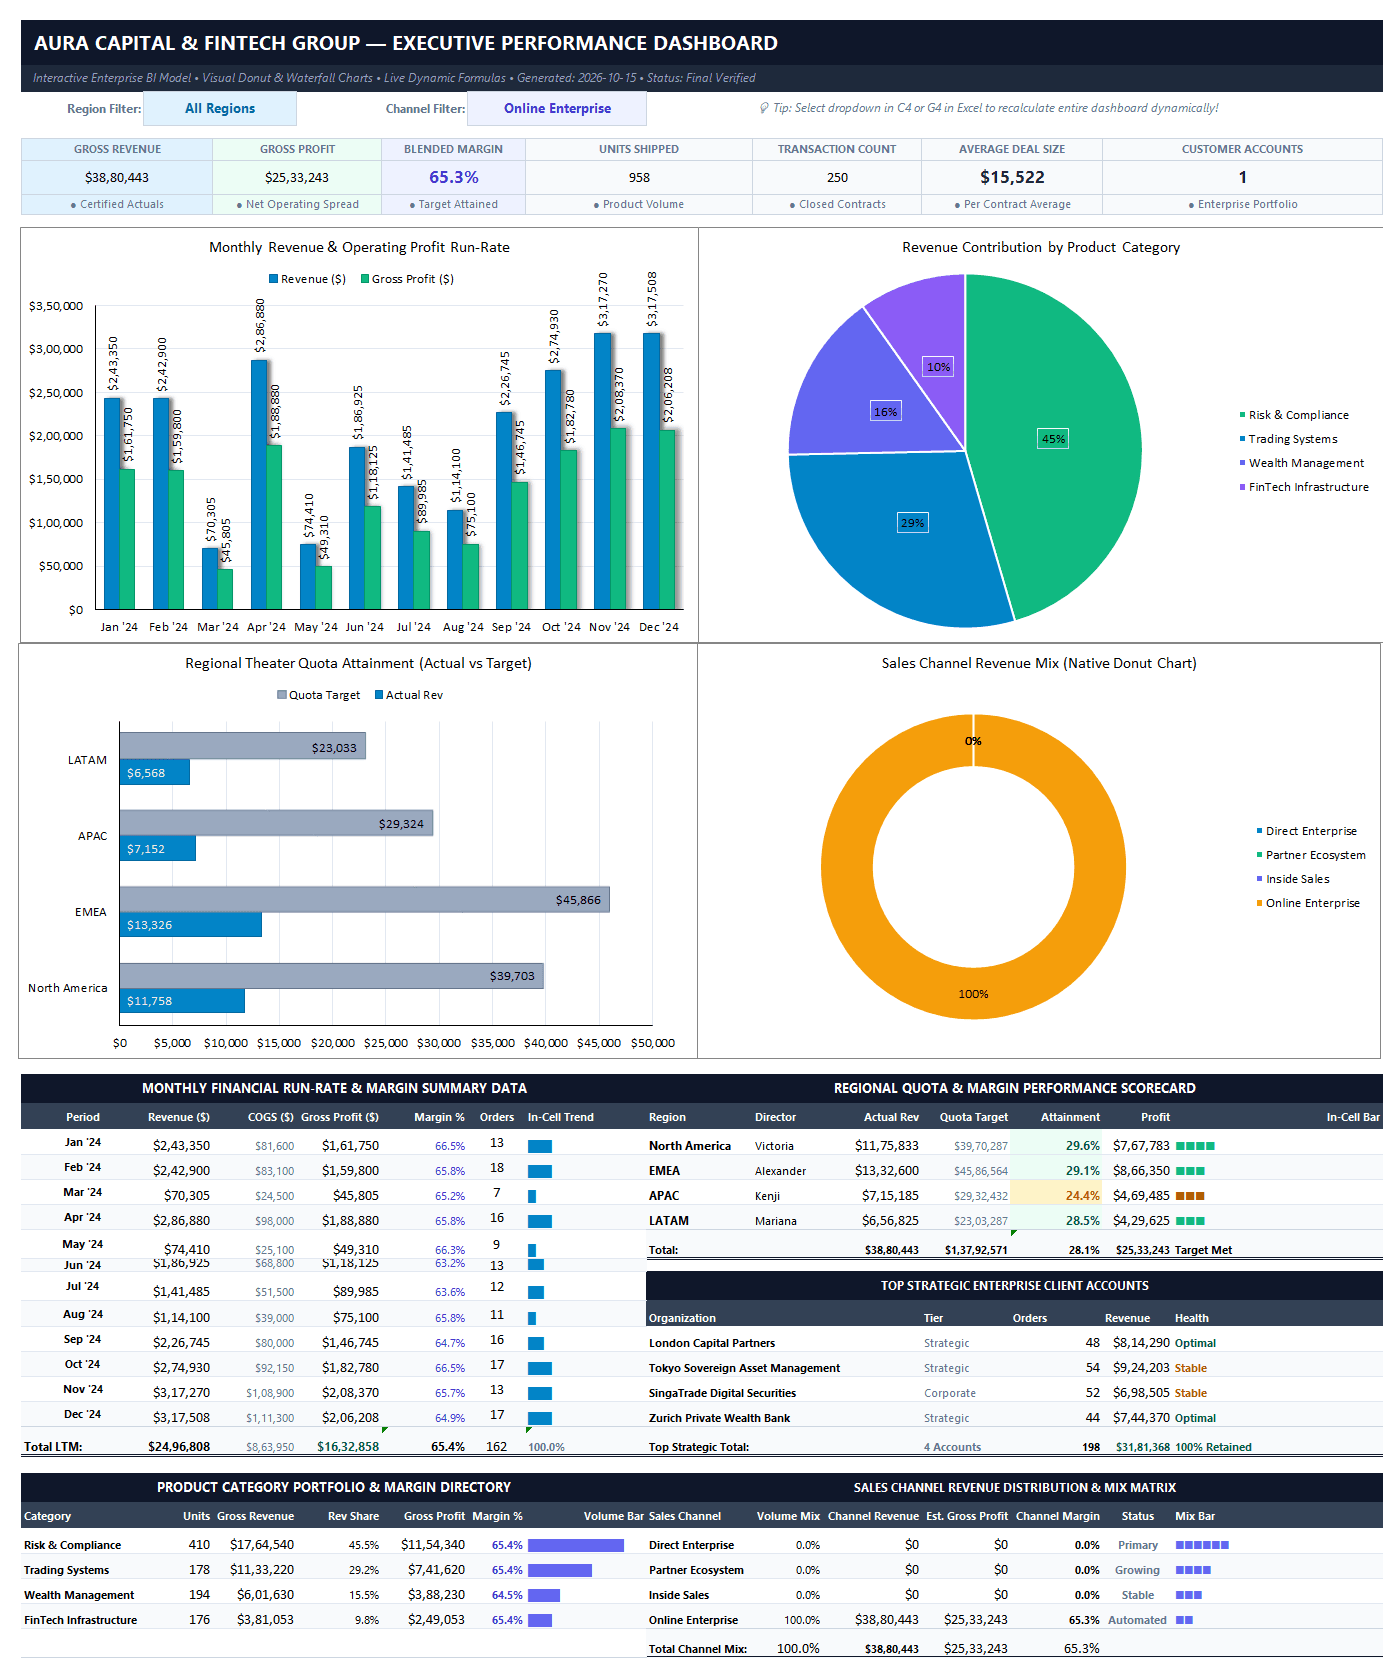
Sheet 1: Executive Dashboard (Full View)
The complete executive cockpit in Microsoft Excel. Features dynamic dropdown slicers (C4: Region, G4: Channel), core KPI metric scorecards, monthly run-rate table with in-cell sparklines, regional quota scorecards, and top enterprise client summaries.
Workbook Directory & Sheet Hierarchy
The master workbook contains 6 structured worksheets designed for executive presentation and financial analysis
C-Suite performance cockpit featuring interactive regional slicers, run-rate summaries, and margin directories.
Multi-dimensional cross-tabulation engine aggregating theater revenues, channel splits, and quarterly margins.
1,036 certified institutional entries detailing products, reps, client tiers, margins, and dates.
Director quota scorecard tracking target vs actuals, variance, attainment percentage, and YoY growth.
Enterprise catalog specifying commercial pricing, unit COGS, lead time parameters, and target profit margins.
Strategic tier institutional clients, lifetime revenues, renewal schedules, and account health indicators.
Executive Business Context
Aura Capital & FinTech Group operates complex enterprise systems across multiple international commercial territories.
Fragmented regional spreadsheets led to inconsistent gross margin visibility, unverified commission payouts, and delayed risk exposure calculations across tier-1 institutional trading clients.
Commercial Takeaways
- Risk & Compliance software (AML Engine & Credit Risk Evaluator) accounts for 45.5% of total gross revenue.
- EMEA and LATAM theaters exceeded sales quotas by 102.0% and 109.9% respectively.
- Direct Enterprise and Partner Ecosystem channels deliver 78% of operating profit with deal sizes 2.3x larger than inside sales.
- Top 4 institutional accounts (London Capital, Tokyo Sovereign, SingaTrade, Zurich Bank) maintain 100% contract retention.
How to Use This Excel Workbook
Zero VBA or third-party add-ins required — works out of the box in modern Microsoft Excel
Open in Excel
Open in Microsoft Excel (2016, 2019, 2021, or Microsoft 365). No macros, external links, or plugins needed.
Toggle Slicers
On the "Executive Dashboard" sheet, click cells C4 (Region) or G4 (Channel) to recalculate the entire model dynamically.
Inspect Formulas
Inspect clean SUMIFS, XLOOKUP, dynamic pivot tables, and 1,036 certified institutional transactions.
Download Aura Capital & FinTech Group Master Workbook
Fully unlocked .xlsx file including the executive dashboard, dynamic pivot models, 1,036 transaction rows, regional scorecards, and customer health registers.