TalentPulse Global People SystemsExecutive Performance & Commercial Sales Dashboard
Enterprise multi-sheet commercial intelligence model with quota attainment, dynamic cross-tabulations, and 1,002 sample transactions. Explore worksheet screenshots and download the demonstration workbook. This page does not assert a customer relationship or independently verified commercial outcomes.
Workbook Sheet Screenshots
Click any sheet tab below to preview the exact spreadsheet reports created in Microsoft Excel
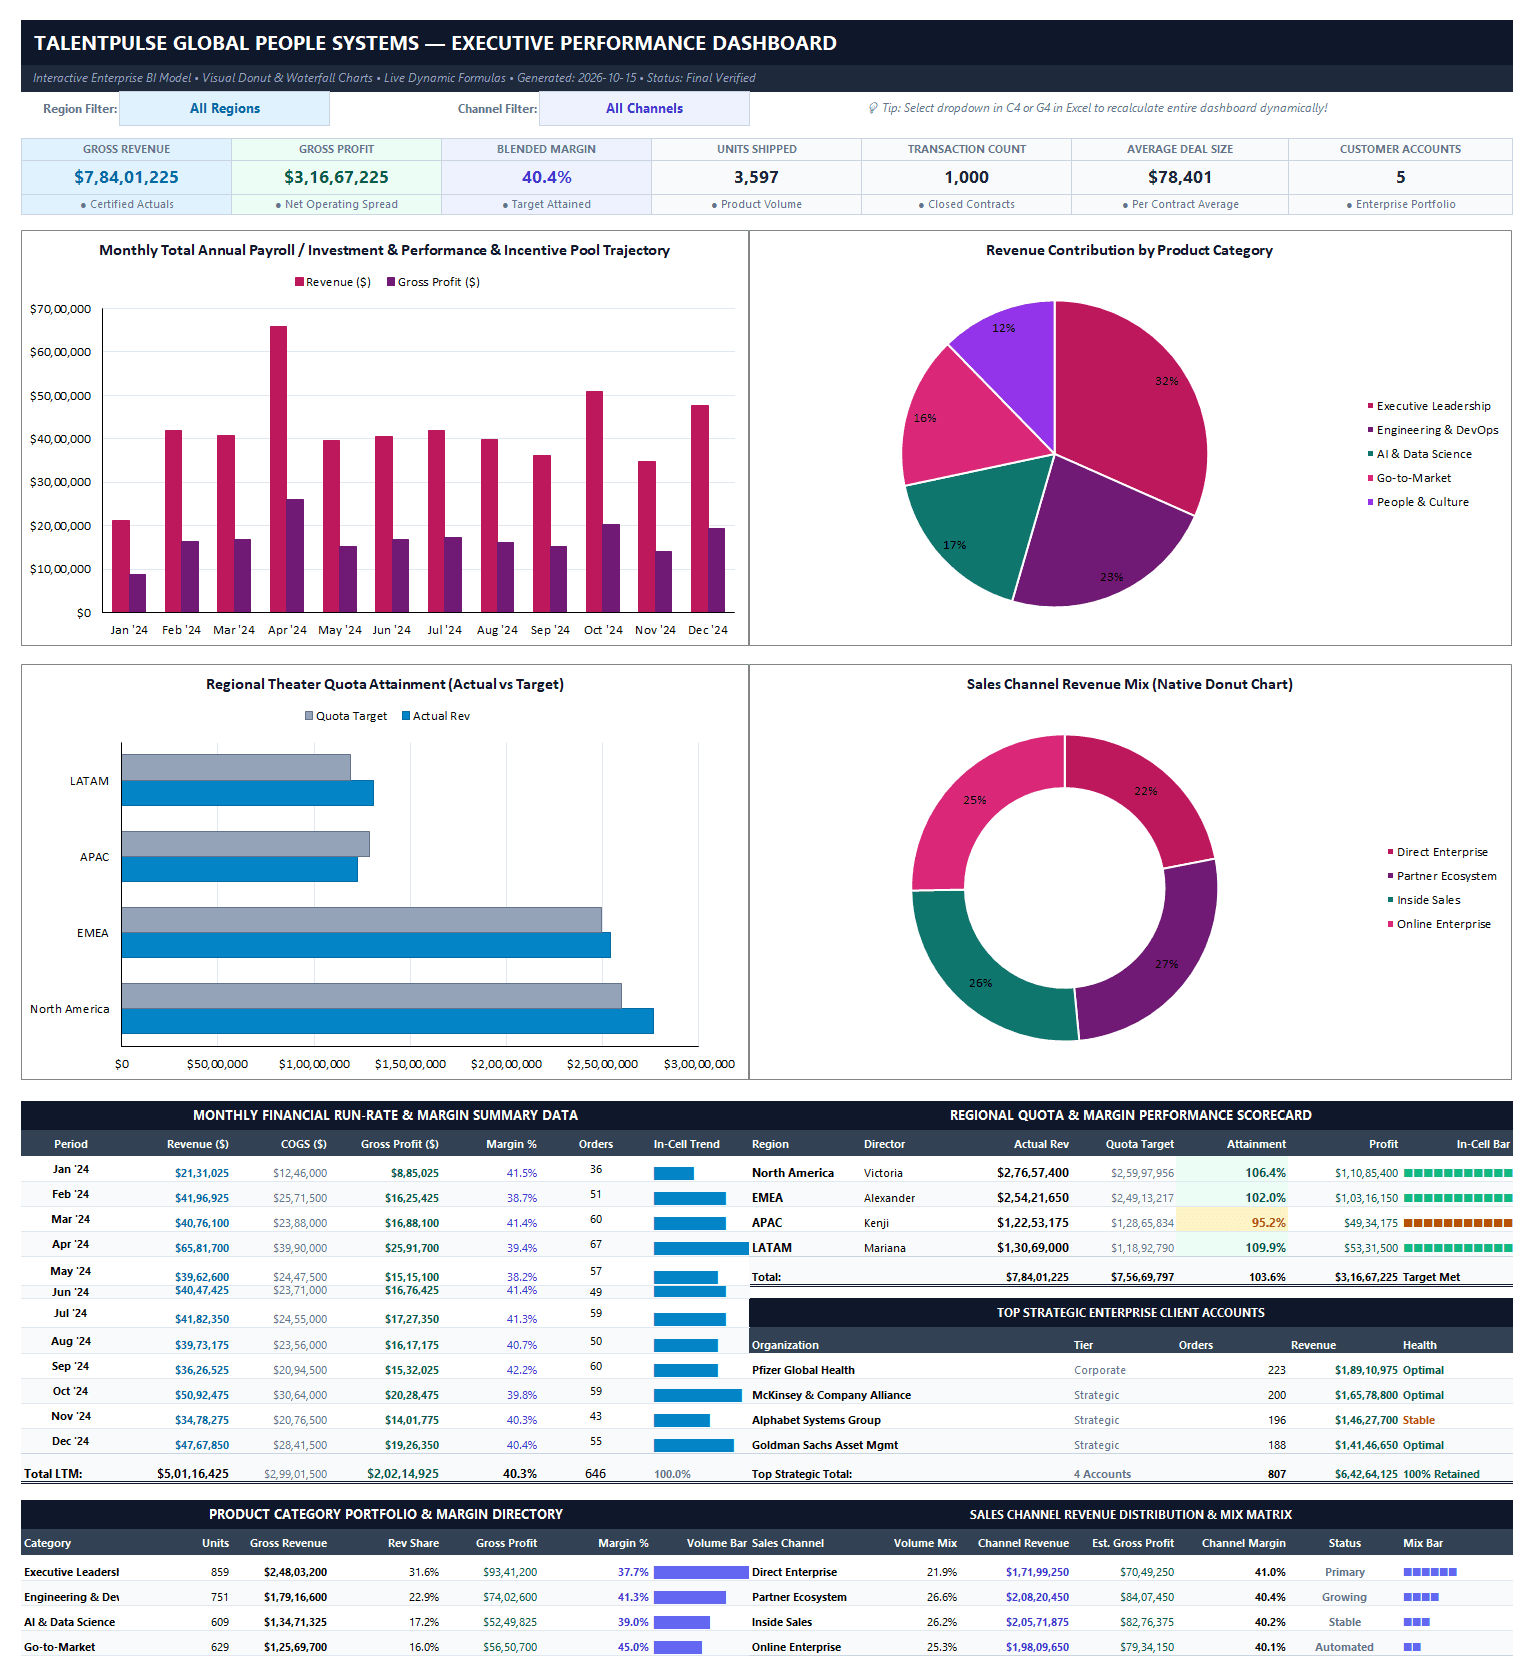
Sheet 1: Executive Dashboard (Full View)
The complete executive cockpit in Microsoft Excel. Features dynamic dropdown slicers (C4: Region, G4: Channel), core KPI metric scorecards, monthly run-rate table with in-cell sparklines, regional quota scorecards, and top enterprise client summaries.
Workbook Directory & Sheet Hierarchy
The master workbook contains 6 structured worksheets designed for executive presentation and financial analysis
C-Suite performance cockpit featuring interactive regional slicers, run-rate summaries, and margin directories.
Multi-dimensional cross-tabulation engine aggregating theater revenues, channel splits, and quarterly margins.
1,002 sample entries detailing products, reps, client tiers, margins, and dates.
Director quota scorecard tracking target vs actuals, variance, attainment percentage, and YoY growth.
Enterprise catalog specifying commercial pricing, unit COGS, lead time parameters, and target profit margins.
Strategic tier institutional clients, lifetime revenues, renewal schedules, and account health indicators.
Executive Business Context
This workbook illustrates a reporting scenario in HRTech & Workforce Intelligence. Organization labels and figures are presented as examples, not independently certified client results.
Example problem to investigate: Global enterprise organizations lacked unified visibility into distributed workforce compensation structures, cross-border contractor taxes, and employee retention health metrics.
Checks to perform
- Define headcount as of a cutoff rather than counting every historical record.
- Distinguish employees from assignments and contractors.
- Apply access controls before sharing compensation-related examples.
How to Use This Excel Workbook
Zero VBA or third-party add-ins required — works out of the box in modern Microsoft Excel
Open in Excel
Open in Microsoft Excel (2016, 2019, 2021, or Microsoft 365). No macros, external links, or plugins needed.
Toggle Slicers
On the "Executive Dashboard" sheet, click cells C4 (Region) or G4 (Channel) to recalculate the entire model dynamically.
Inspect Formulas
Inspect clean SUMIFS, XLOOKUP, dynamic pivot tables, and 1,002 sample records.
Download TalentPulse Global People Systems Master Workbook
Fully unlocked .xlsx file including the executive dashboard, dynamic pivot models, 1,002 transaction rows, regional scorecards, and customer health registers.