Enterprise Power BI Dashboard — Nine-Page Analytics Suite
A documented analytics blueprint covering executive reporting, sales, products, customers, regions, profitability, returns and forecast scenarios.
Project overview
Synthetic retail analytics blueprint. A documented analytics blueprint covering executive reporting, sales, products, customers, regions, profitability, returns and forecast scenarios. The scope is documented below so reviewers can distinguish delivered capabilities from design targets.
The engineering challenge
A credible BI portfolio needs reconciled data, consistent metric definitions and reproducible visual specifications rather than unexplained dashboard images.
Solution architecture
A synthetic retail star schema, DAX library, workbook handbook and nine visual build guides form a reproducible report-authoring reference.
Five relational synthetic-data tables describe orders, customers, products, returns and forecasts.
Star-schema relationships, Power Query guidance and 66 documented DAX measures define the semantic layer.
Nine visual specifications and an Excel implementation handbook guide construction in Power BI Desktop.
Implementation
- Nine dashboard designs and field-level visual build guides.
- Synthetic data reconciled to $12,840,570 in gross sales, 178,200 orders and 46,798 customer records.
- DAX source, relationship documentation, validation scripts and a reproducible authoring handbook.
Visual gallery
Each asset is classified and linked to its source. Design references are not presented as completed application screens.
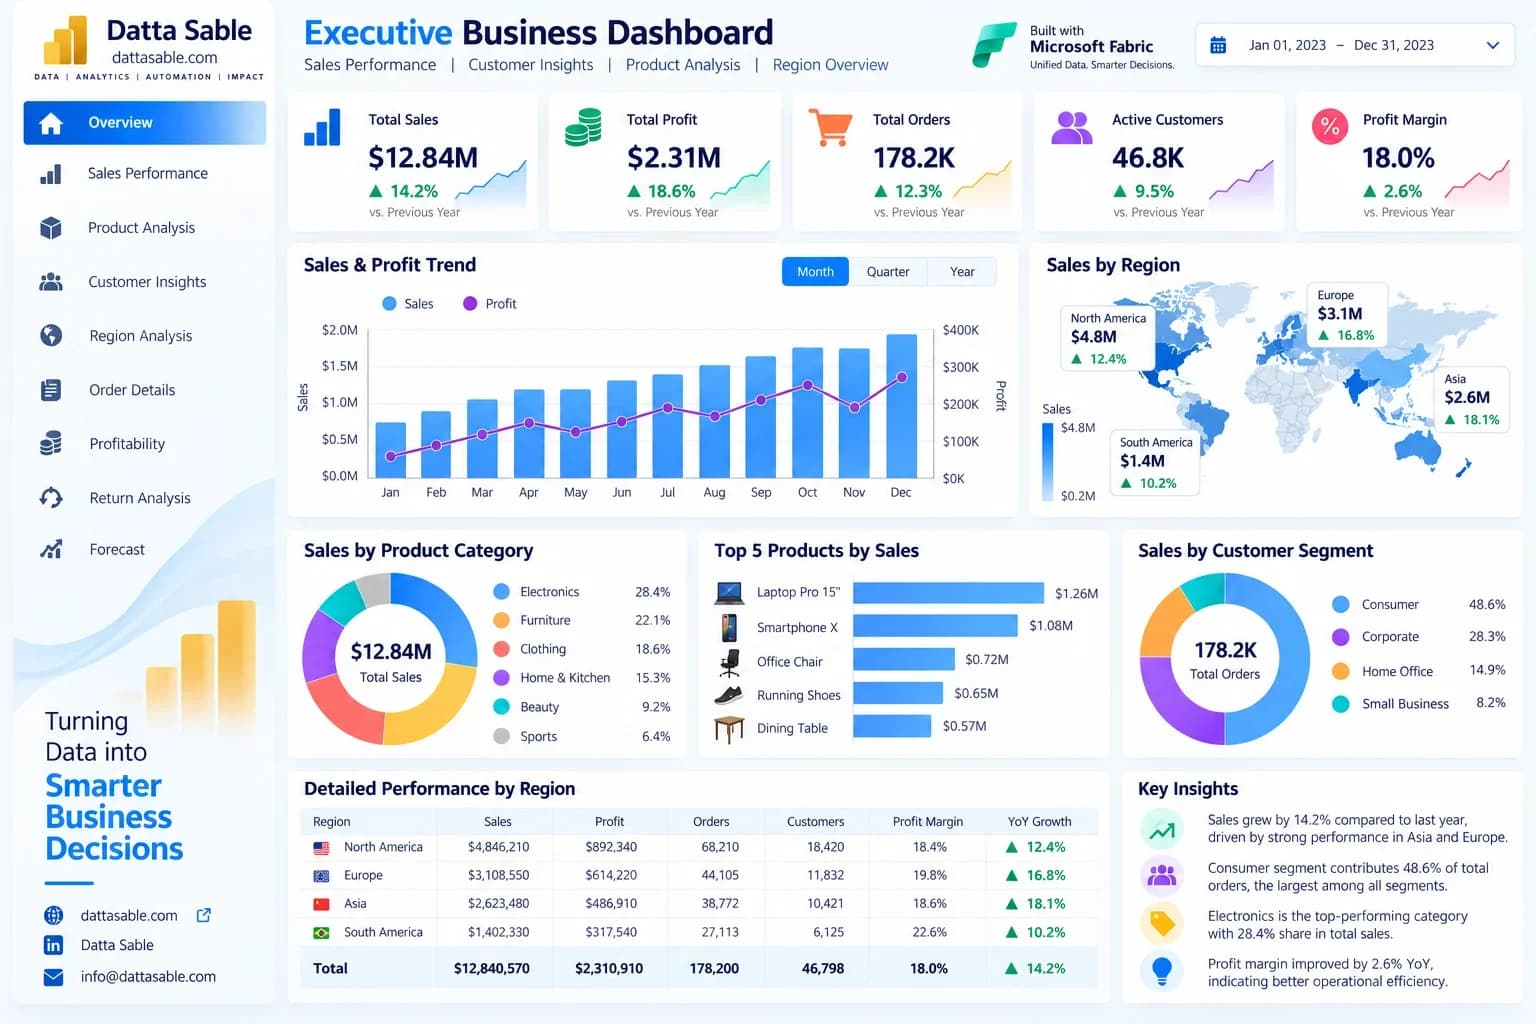
View original source ↗
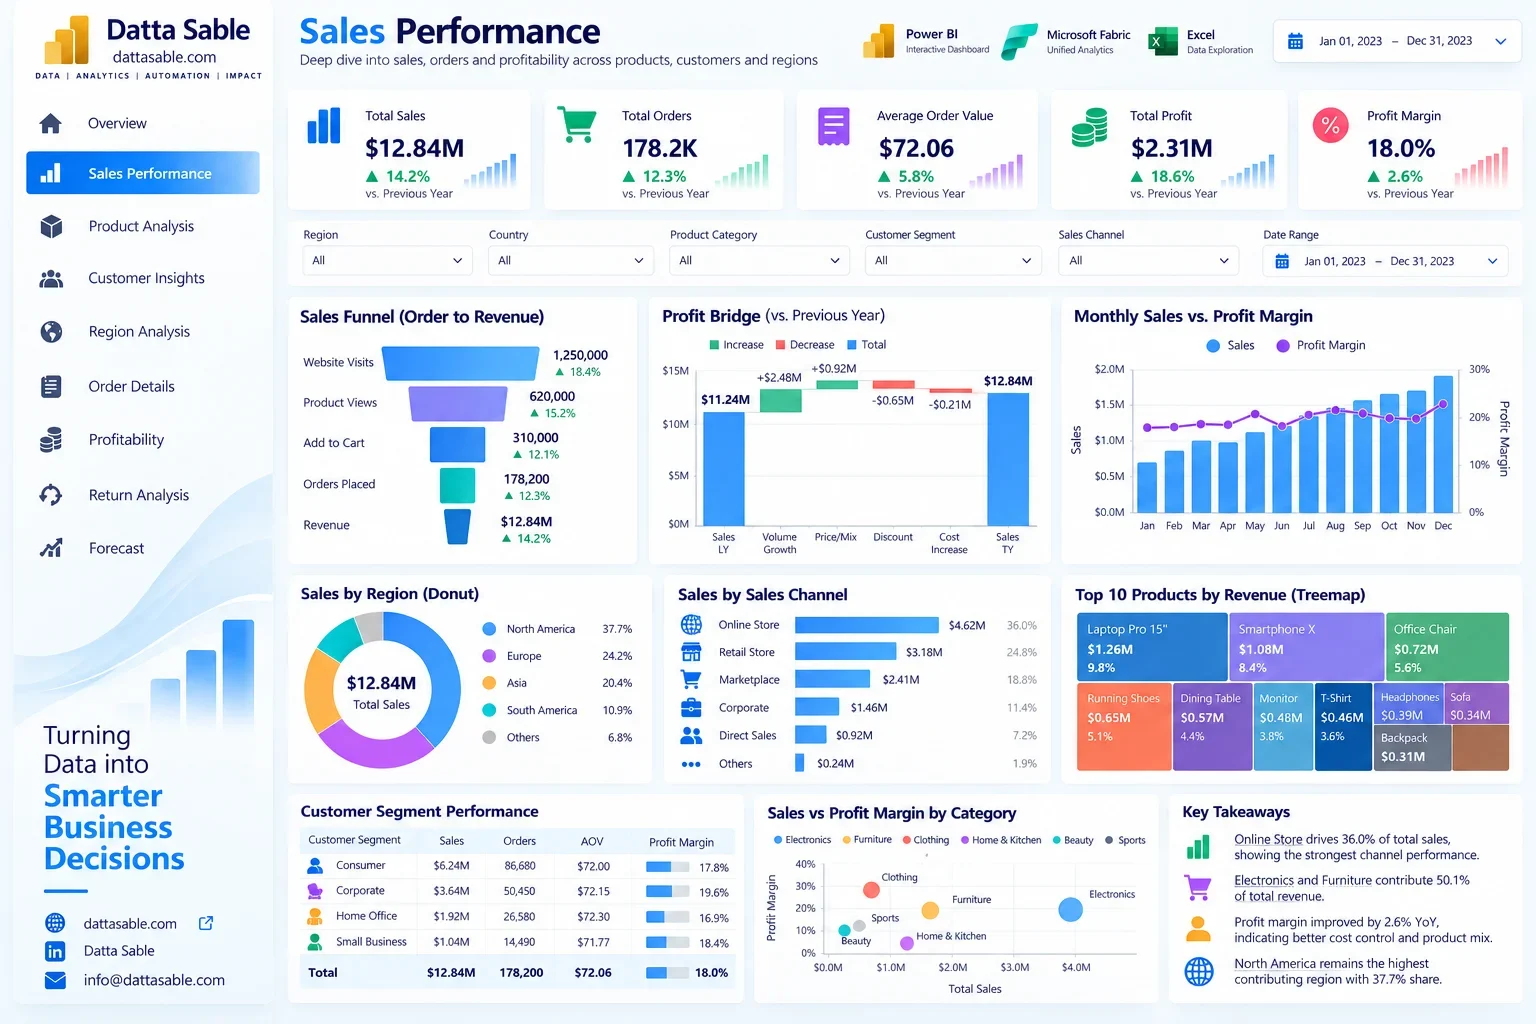
View original source ↗
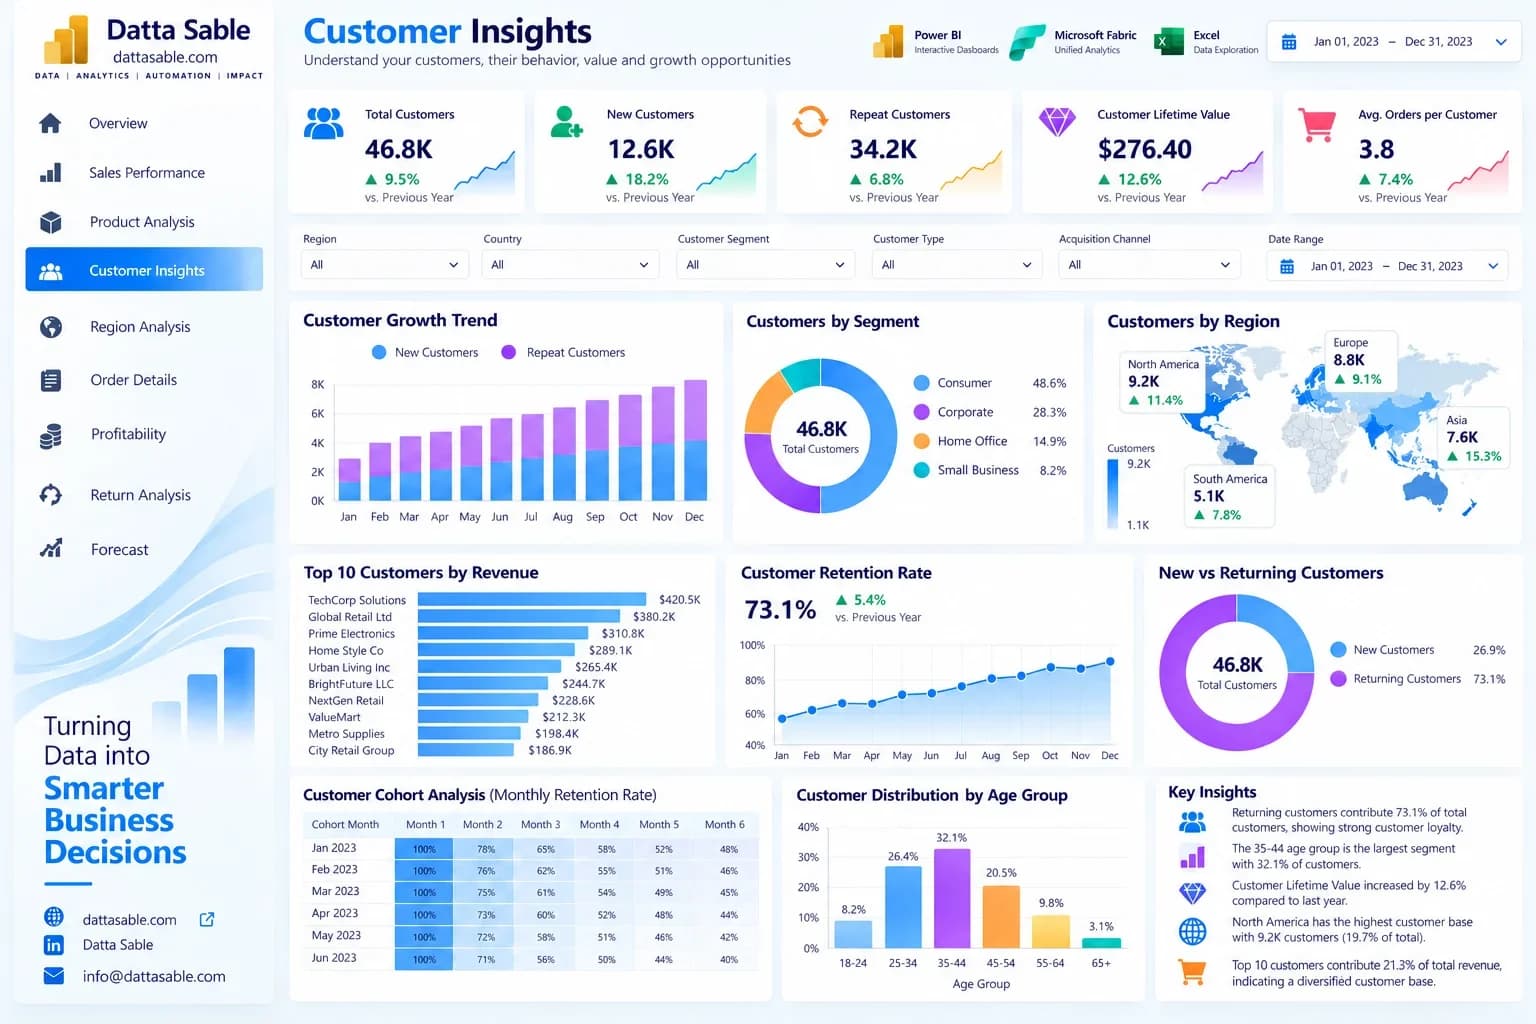
View original source ↗
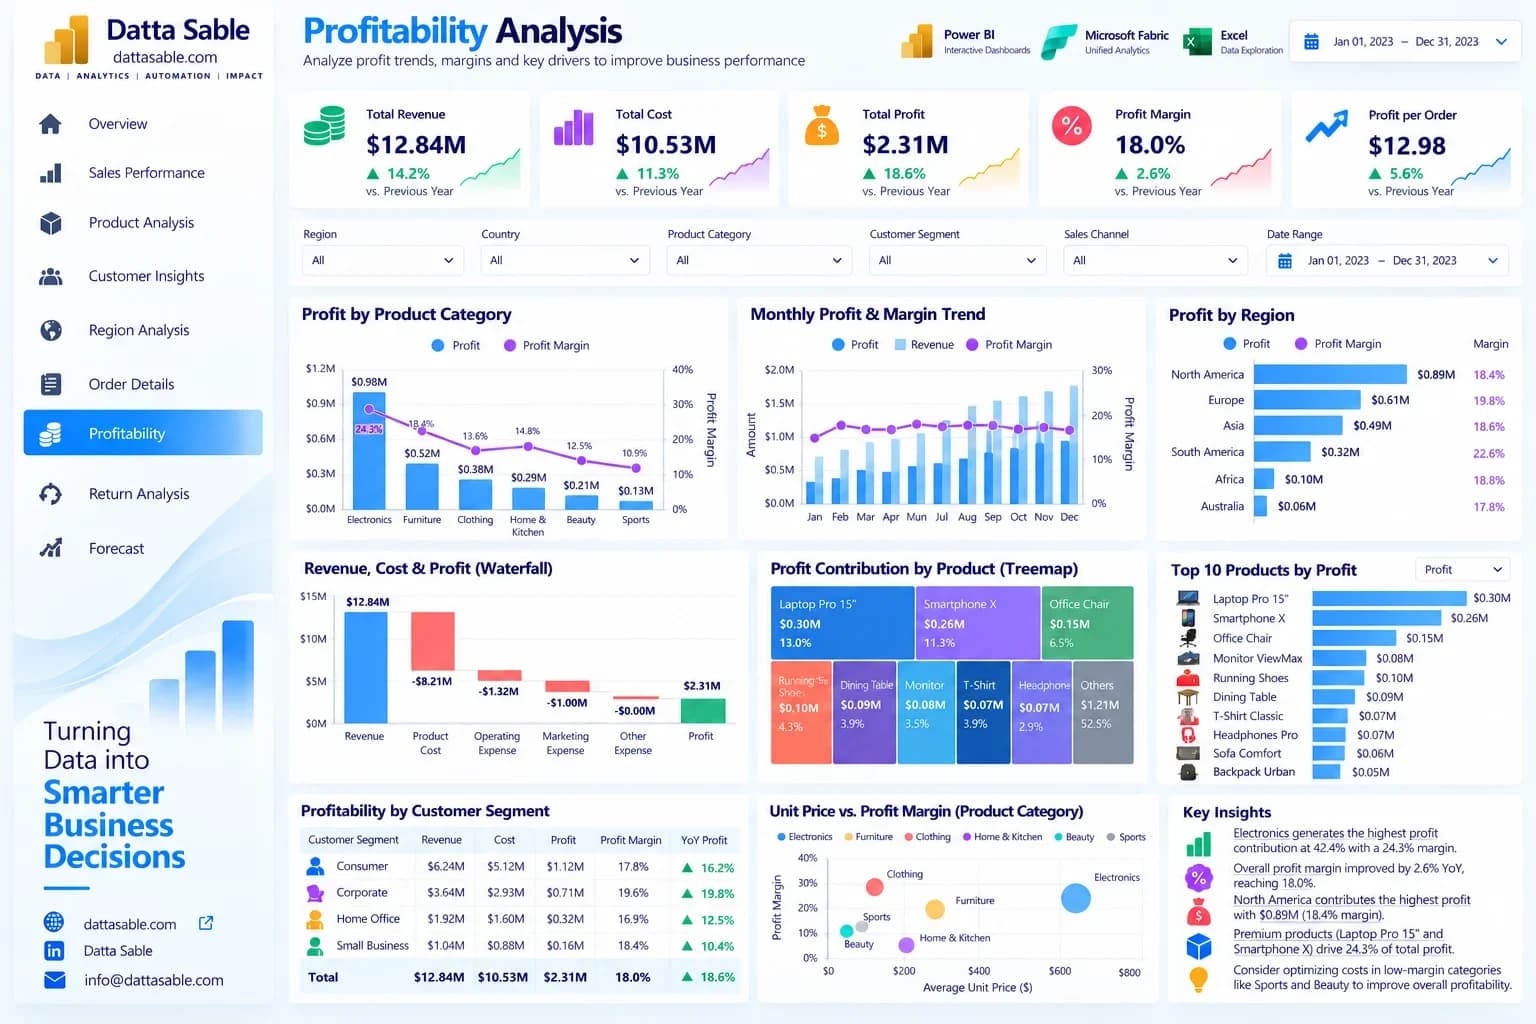
View original source ↗
View original source ↗
Technical evidence
The README reconciles $12.84M illustrative revenue, 178,200 orders and 46,798 synthetic customers. Visuals are design references, not compiled reports.
Reviewed from public interfaces and repository documentation on 29 October 2026. Upstream tests and benchmarks were not rerun as part of this website implementation.
Limitations & scope
- Financial values are synthetic demonstration data, not client revenue.
- Images are mockups and architectural design references. A compiled PBIX is not included.
- DAX syntax and schema references are source-reviewed; Power BI Desktop execution remains pending.
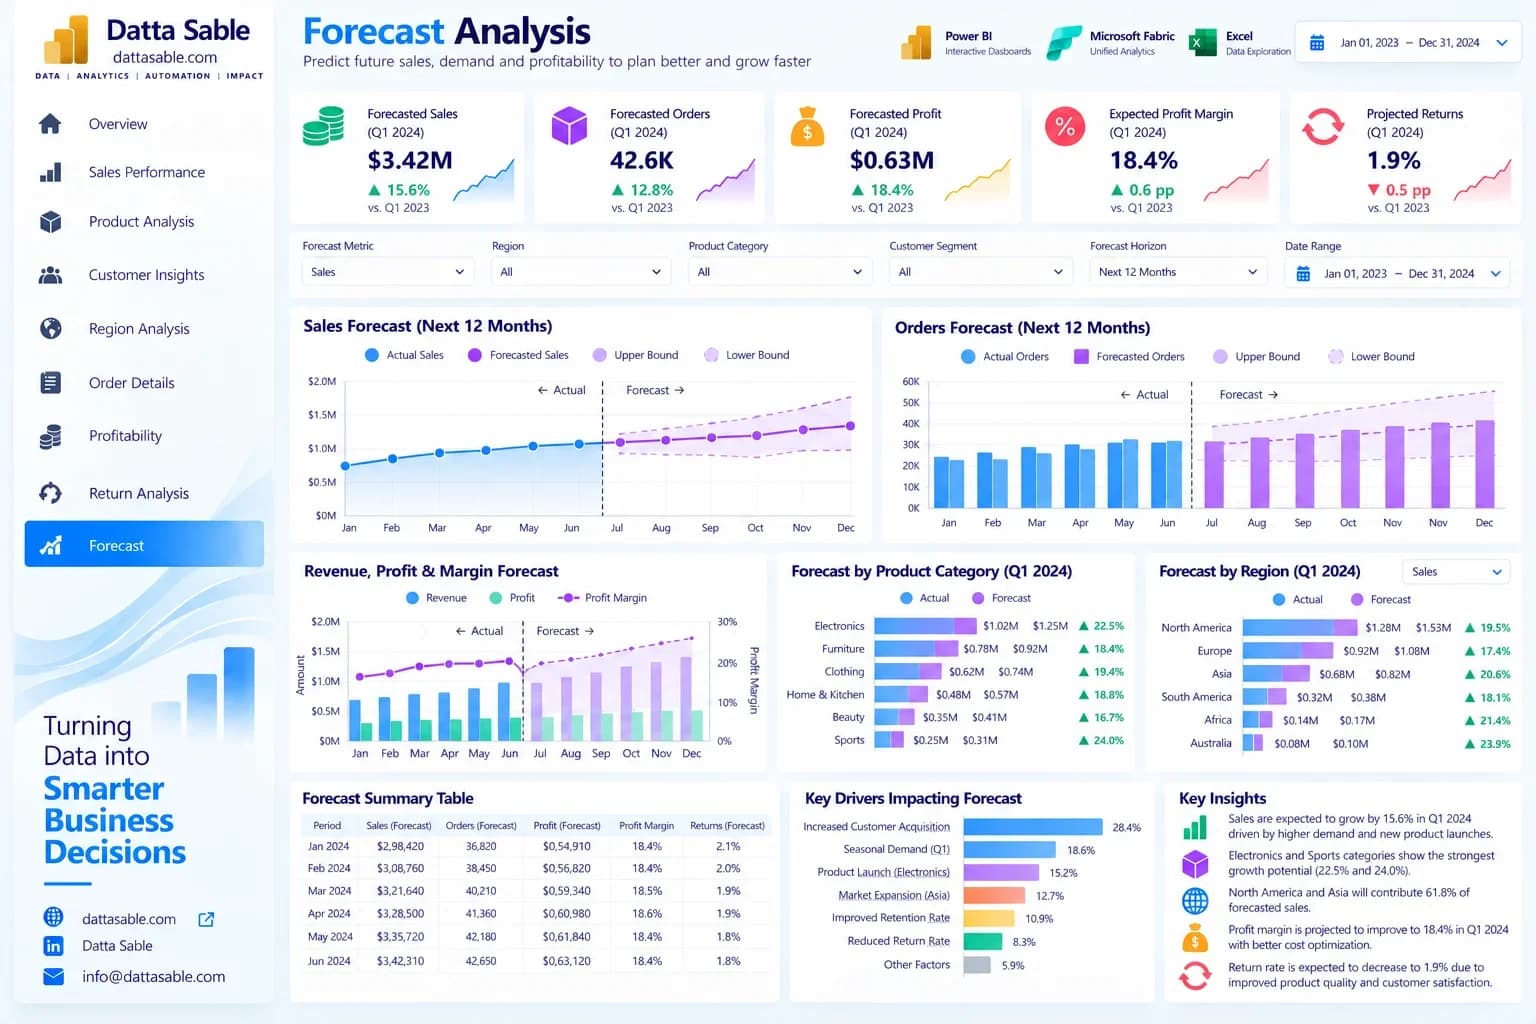
- Forecast ±12% bands are illustrative planning assumptions, not statistical confidence intervals.