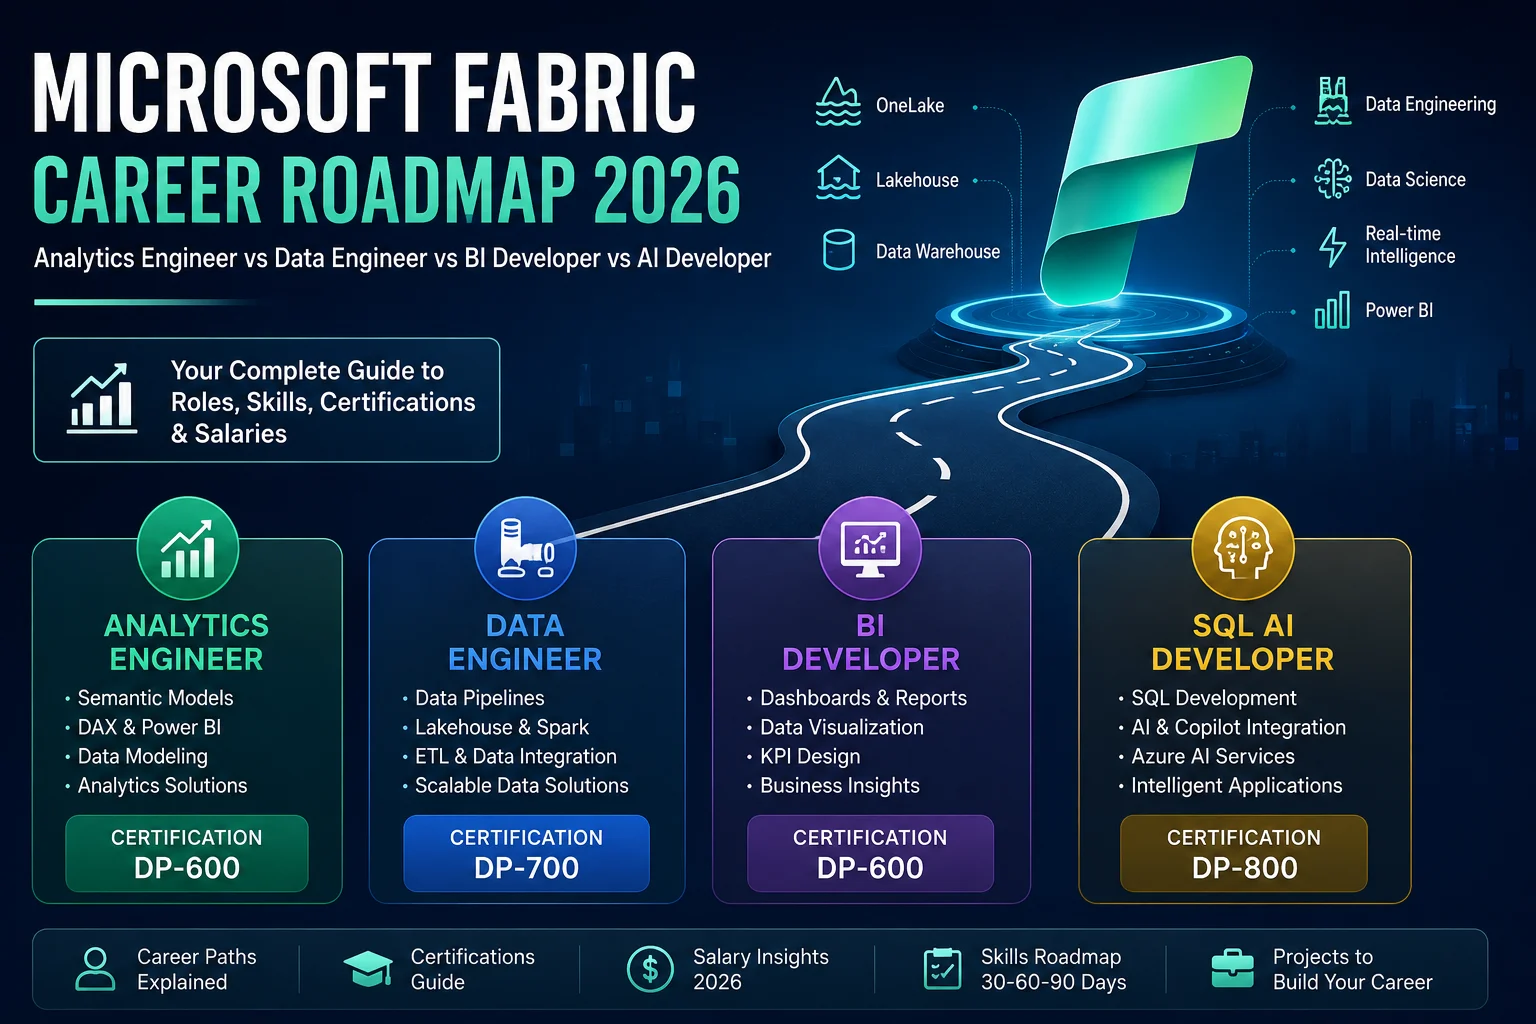

The Modern Microsoft Data Certification Landscape
The transition from isolated business intelligence tools to unified SaaS analytics platforms has reshaped career requirements for data practitioners. Professionals entering or advancing within the Microsoft ecosystem must choose certification pathways aligned with their specialized competencies: reporting, analytics engineering, or enterprise data infrastructure.
Microsoft offers three primary credentials spanning this domain:
- PL-300 (Power BI Data Analyst): Validates data modeling, DAX measure authoring, visual report design, workspace permissions, and dashboard delivery. Target audience: Business Analysts, BI Developers, and Financial Reporting Specialists.
- DP-600 (Fabric Analytics Engineer): Validates OneLake architecture, medallion Lakehouse design, T-SQL Warehouses, PySpark data wrangling, and Direct Lake semantic modeling. Target audience: Analytics Engineers and Senior BI Architects.
- DP-700 (Fabric Data Engineer): Validates real-time event streaming, Spark optimization at scale, orchestration pipelines, Lakehouse security, and complex multi-source integration. Target audience: Cloud Data Engineers and Big Data Architects.
Structured 8-Week Preparation Schedule
A structured approach ensures theoretical knowledge translates into hands-on proficiency using the Microsoft Fabric 60-day trial capacity:
Phase 1: Storage and Governance (Weeks 1-2)
  ├── Provision Fabric Trial Capacity and Configure Tenant Workspace
  ├── Create Lakehouses and Warehouses in OneLake
  └── Implement OneLake Shortcuts to external ADLS Gen2 storage

Phase 2: Data Transformation (Weeks 3-4)
  ├── Ingest CSV/Parquet files using Data Factory Copy Activities
  ├── Build PySpark notebooks for data cleaning, type casting, and deduplication
  └── Configure Dataflows Gen2 with Staging Lakehouse destinations

Phase 3: Semantic Modeling & Direct Lake (Weeks 5-6)
  ├── Design Star Schema Dimensional Models (Fact/Dim tables)
  ├── Build Direct Lake Semantic Models in Power BI Web Modeler
  └── Audit model for DirectQuery fallback using DAX Studio & Performance Analyzer

Phase 4: ALM, Security & Exam Simulation (Weeks 7-8)
  ├── Connect Workspace to Git (Azure DevOps / GitHub)
  ├── Configure Deployment Pipelines (Dev -> Test -> Prod)
  └── Complete official Microsoft Learn practice assessment tests
Auditing Performance with T-SQL System Views
Exam candidates must know how to inspect query performance and resource consumption inside Fabric Warehouses. Fabric exposes dynamic management views (DMVs) for tracking distributed statement execution:
-- Query Warehouse Execution Insights for long-running queries
SELECT
    distributed_statement_id,
    batch_id,
    command,
    status,
    total_elapsed_time_ms,
    allocated_cpu_time_ms,
    row_count
FROM queryinsights.exec_requests_history
WHERE start_time >= DATEADD(day, -7, GETUTCDATE())
  AND total_elapsed_time_ms > 5000
ORDER BY total_elapsed_time_ms DESC;
Monitoring these execution logs enables data engineers to identify unindexed joins, large data scans, and query plan inefficiencies before pushing semantic models to executive production reports.