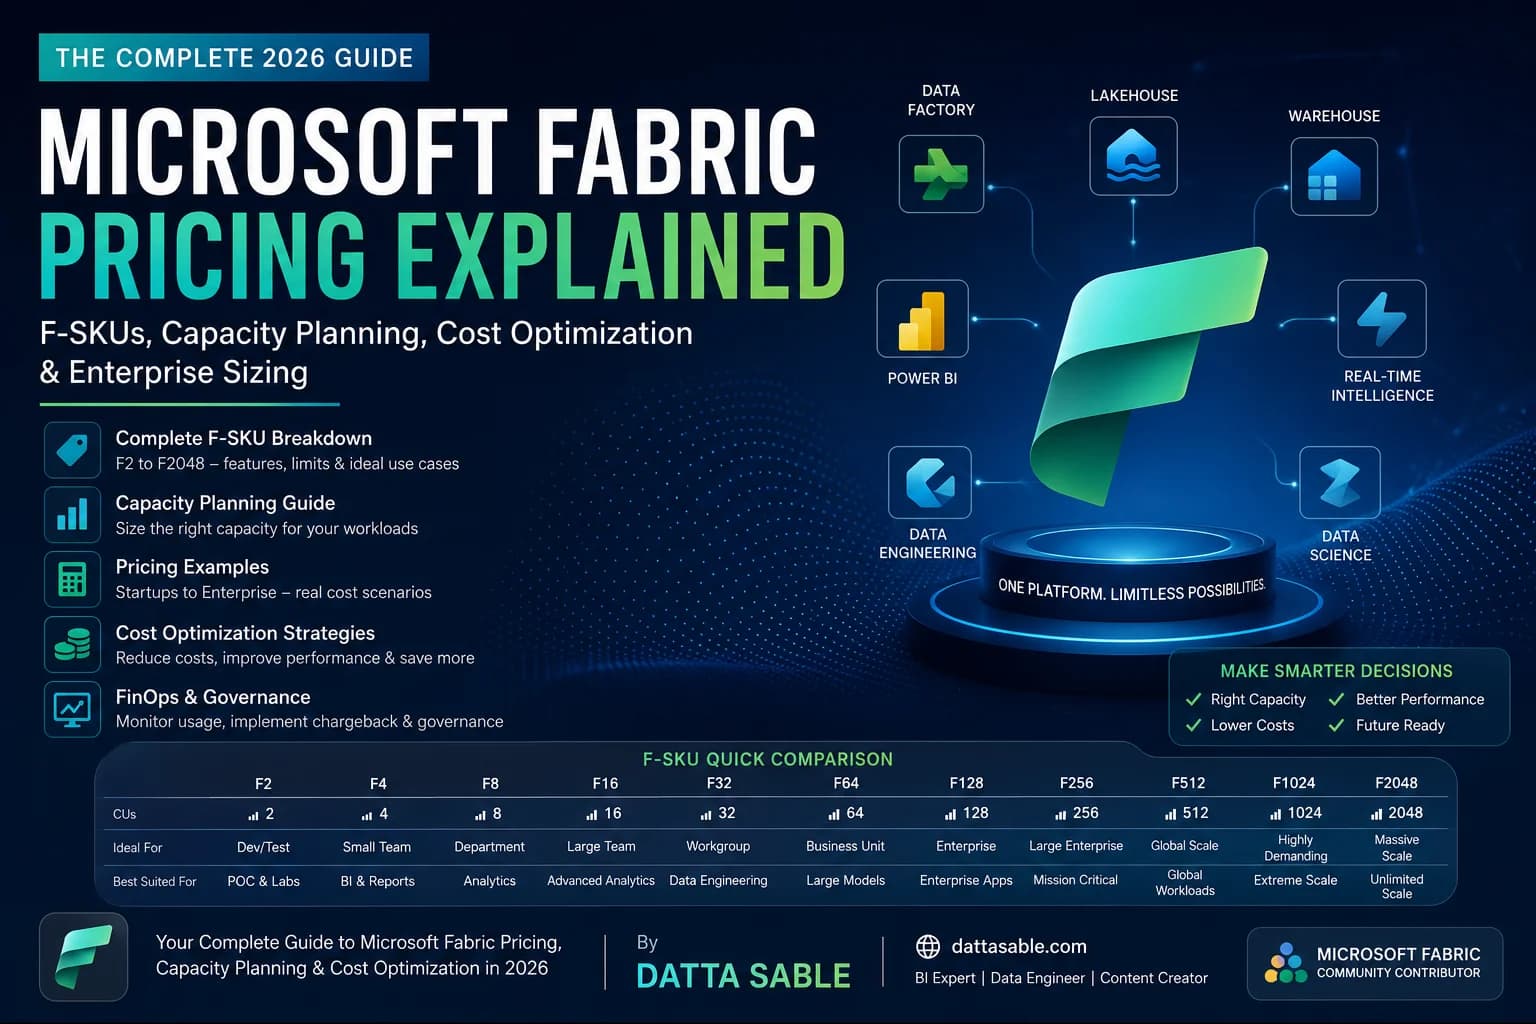

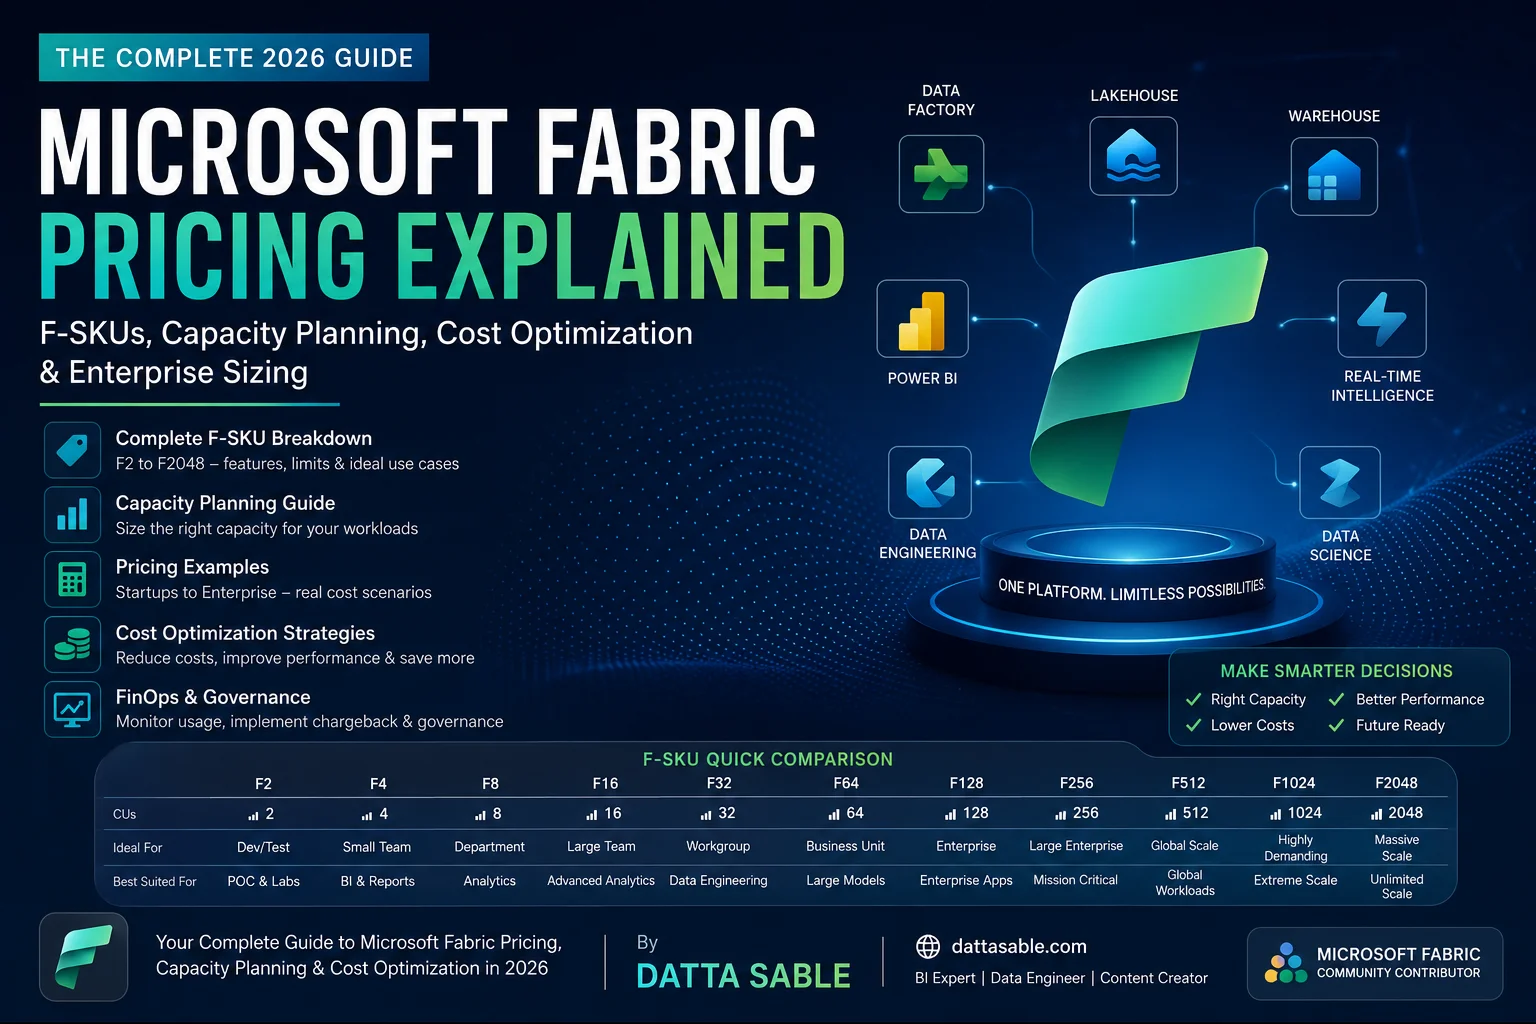
Microsoft Fabric Pricing in 2026 is built on a single, capacity-based model: you purchase a pool of Capacity Units (CUs), assign it to a workspace, and every workload — Spark, SQL, Power BI, Data Factory, Real-Time Intelligence — draws from that same shared pool. This guide covers every F-SKU from F2 to F2048, shows you how to estimate cost for your specific workload profile, and gives you the FinOps playbook enterprises use to cut Fabric spend by 30–60%.
Table of Contents
- 1. Executive Summary
- 2. Quick Decision Table
- 3. Understanding Fabric Pricing
- 4. Capacity Units Explained
- 5. Complete F-SKU Breakdown
- 6. Pricing Examples
- 7. Capacity Planning Framework
- 8. Real Enterprise Scenarios
- 9. Fabric vs Power BI Premium
- 10. Fabric vs Synapse
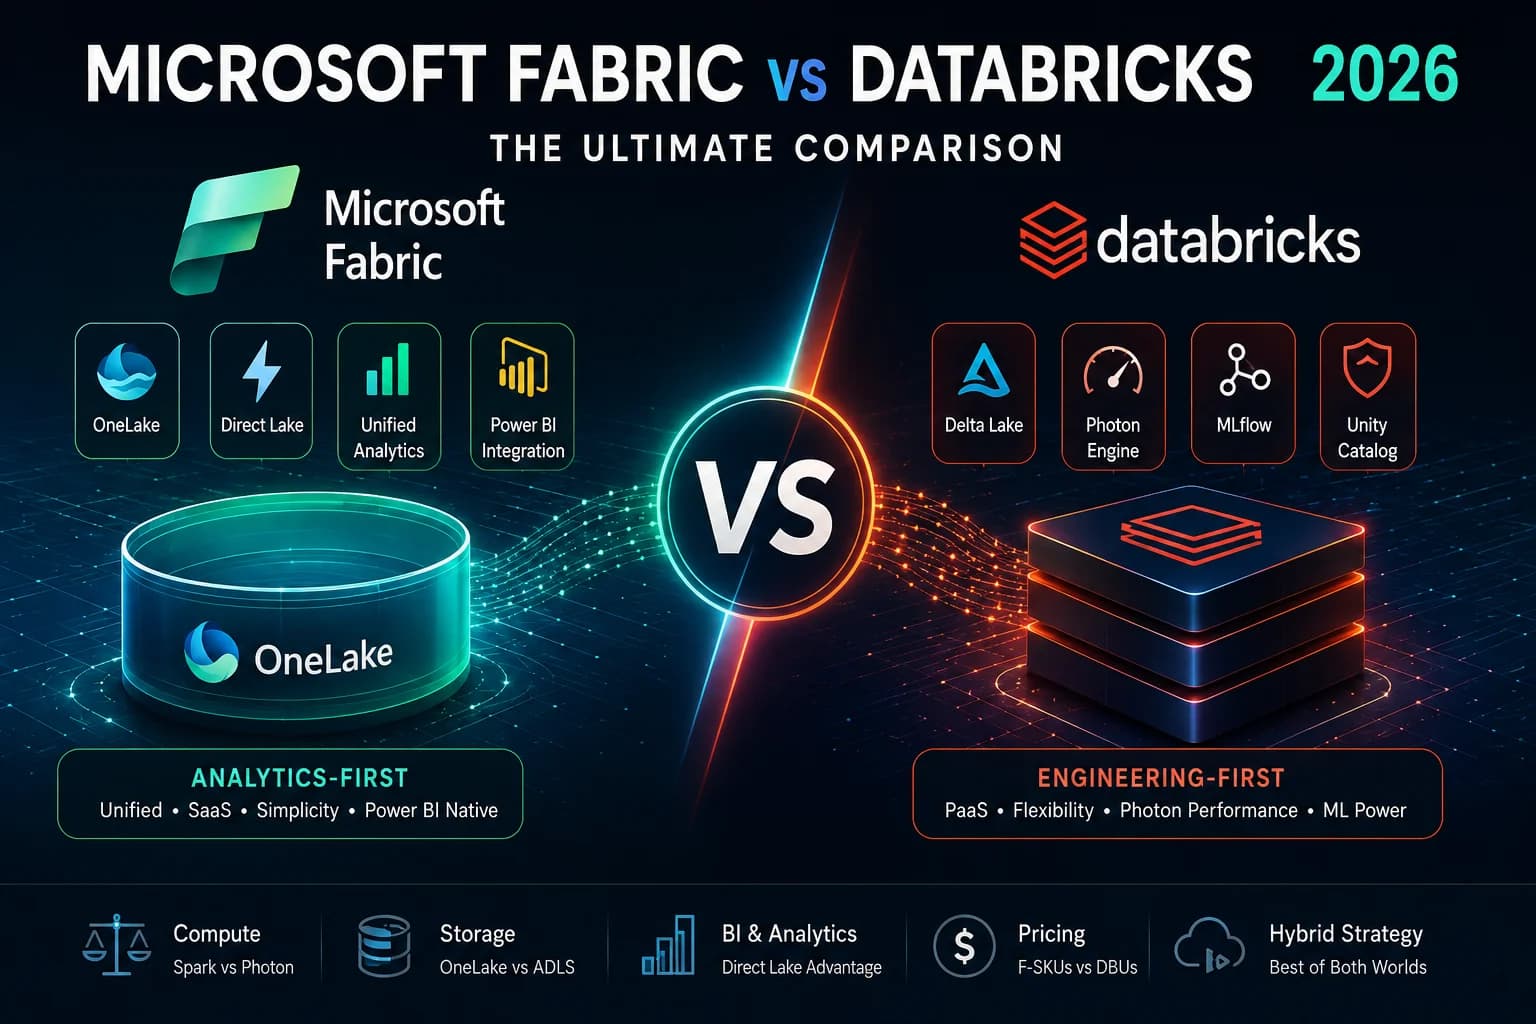
- 11. Fabric vs Databricks
- 12. Cost Optimization
- 13. Fabric FinOps
- 14. Capacity Monitoring
- 15. Common Mistakes
- 16. FAQs
- 17. Conclusion & Decision Tree
1. Executive Summary
Microsoft Fabric pricing is deceptively simple on the surface: you buy capacity, you use it, you pay for what you buy. In practice, getting this right requires a working understanding of how Capacity Units are consumed across seven distinct workload types simultaneously, how Microsoft's smoothing algorithm prevents short-duration bursts from immediately triggering throttling, and why a team that bought an F64 last year is now running out of CUs after adding three Power BI Semantic Models.
I've designed Fabric platforms for enterprises across manufacturing, retail, banking, and healthcare over the past two years. The pricing and capacity questions are almost always the same: "We're paying $X per month — is that right? How many users can we support? Will adding another Spark workload break our dashboards?" This guide is the reference I wish had existed when I started these conversations.
Here is the high-level picture before we go deep:
- Microsoft Fabric is a SaaS analytics platform that consolidates data engineering, data science, warehousing, real-time analytics, and Power BI under one roof with one storage layer (OneLake) and one compute billing model (Capacity Units).
- All compute workloads share a single CU pool. Spark jobs, SQL queries, Power BI report refreshes, Data Factory pipelines, and Real-Time Intelligence all draw from the same capacity pool you purchased.
- F-SKUs range from F2 to F2048. F2 costs roughly $262/month and suits small PoCs. F2048 costs around $268,000/month and serves the largest global enterprises. Most production deployments land between F8 and F128.
- Storage is billed separately at approximately $0.023 per GB/month — usually a rounding error compared to compute costs.
- Reserved Capacity (1-year or 3-year) saves 37–52% over pay-as-you-go rates — the single most impactful cost lever available.
- Pausing and resuming capacity eliminates costs during off-hours, making pay-as-you-go viable for environments with predictable usage patterns.
Who this guide is for: Data engineers estimating their first Fabric deployment, Power BI developers migrating from Premium Per User, solution architects making SKU recommendations to a CTO, enterprise architects designing multi-workspace governance frameworks, FinOps practitioners building showback reports, IT managers evaluating total cost of ownership versus Databricks or Snowflake, and candidates preparing for DP-600 or DP-700 exams who need to understand the capacity model deeply.
What you'll be able to do after reading this: Choose the right SKU for your workload profile, build a bottom-up cost estimate for a stakeholder presentation, configure Reserved Capacity to cut costs by half, monitor capacity utilization without guessing, and avoid the 25 most common mistakes that cause enterprises to overspend or underperform on Fabric.
2. Quick Decision Table
If you need an immediate orientation before reading the rest of this guide, this table maps company size and workload type to the most common starting SKU. These are starting points — your actual requirements may be higher or lower depending on workload intensity.
| Company Size / Use Case | Recommended SKU | Est. BI Users | Est. Monthly Cost (PAYG) | Typical Workloads |
|---|---|---|---|---|
| Proof of Concept / Learning | F2 | 1–5 | ~$262 | Light Lakehouse, small notebooks, basic Power BI reports |
| Small Team / Startup | F4 / F8 | 5–25 | $524 – $1,048 | Medallion pipelines, Dataflows Gen2, daily refreshes, 3–5 dashboards |
| Mid-Market Company | F16 / F32 | 25–150 | $2,097 – $4,194 | Multi-domain Lakehouse, Spark ETL, Warehouse, real-time dashboards |
| Enterprise (Division level) | F64 | 150–500 | ~$8,388 | Full Medallion, Mirroring, Direct Lake large models, streaming |
| Large Enterprise | F128 / F256 | 500–2,000 | $16,776 – $33,553 | Multi-domain platform, concurrent Spark + SQL + heavy BI |
| Global Enterprise | F512+ | 2,000+ | $67,107+ | Global multi-region, high concurrency, AI, Real-Time Intelligence |
| Power BI-only migration from PPU | F4 / F8 | 10–100 | $524 – $1,048 | Power BI semantic models, scheduled refreshes, embedded reporting |
Note: Prices shown are approximate US East pay-as-you-go rates. Regional pricing varies. Apply a 1-year Reserved Capacity discount of approximately 37% to get the reserved price. Verify all pricing on the Azure pricing calculator before procurement decisions.
3. Understanding Microsoft Fabric Pricing
3.1 The History: How We Got Here
To understand why Fabric pricing works the way it does, you need to understand the mess it replaced. Before Fabric's general availability in November 2023, a typical enterprise Microsoft analytics stack had at least six independently billed components: Azure Data Factory (pipeline runs billed per activity), Azure Data Lake Storage Gen2 (billed per GB and per transaction), Azure Synapse Analytics (dedicated SQL pool billed per DWU-hour plus Spark pool billing per vCore-hour), Azure Analysis Services or Power BI Premium (billed per node tier), and Azure Monitor (for logs).
These services had different billing APIs, different cost centers, and different utilization patterns. A FinOps team trying to answer "how much did the quarterly financial report cost us to run?" had to join cost records across six services and account for indirect costs like storage reads from Data Factory, which billed differently than storage reads from Synapse. The result was that most teams had no idea what their analytics infrastructure actually cost at a workload level.
Microsoft Fabric changed this by introducing a single shared capacity pool model. You buy capacity measured in CUs. Every workload — regardless of whether it's a Spark notebook, a SQL query, a Power BI refresh, or a pipeline run — consumes from that same pool. The billing unit is the CU-second, and your monthly bill is a function of the SKU size you're running times the number of hours it runs.
3.2 Capacity Model vs Consumption Model
Capacity Model (F-SKU): You provision a fixed-size capacity — an F8, an F64, an F256 — and pay for it by the hour regardless of whether workloads are running. This is analogous to renting a server rack: the cost is predictable and the performance ceiling is defined by the SKU. Most enterprises run on this model because predictable billing simplifies budgeting.
Pay-as-you-go (Consumption) Model: Fabric also offers a consumption-based model for specific workloads (primarily Data Factory pipelines and certain Eventstream scenarios) where you pay per unit of work done rather than per hour of capacity. This is useful for workloads with highly variable volume — you're not paying for idle time. For most teams, the F-SKU capacity model is the right choice.
3.3 Shared vs Dedicated Capacity
- Shared Capacity (Free Trial): Microsoft provides a 60-day free Fabric trial with a small shared capacity pool. Suitable for individual exploration only. Performance is not guaranteed, and it cannot be used for production workloads.
- Dedicated Capacity (F-SKU): You purchase a capacity provisioned exclusively for your tenant. CUs are not shared with other customers. This is the model for all development, test, and production deployments beyond basic exploration.
To fully grasp this concept, we recommend reviewing our foundational guide first:
→ Microsoft Fabric Architecture4. Capacity Units Explained
4.1 What Is a Capacity Unit?
A Capacity Unit (CU) is Microsoft's abstraction for compute resources in Fabric. Rather than exposing raw CPU cores, RAM, or Spark executor counts, Fabric expresses all compute as CUs — a normalized unit that accounts for both CPU and memory proportionally. An F8 capacity provides 8 CUs of concurrent compute. Every workload you run costs some number of CU-seconds. If the rate of consumption exceeds your capacity's available CU rate, Microsoft applies smoothing before throttling.
4.2 Interactive vs Background Operations
One of the most important concepts in Fabric's CU model is the distinction between Interactive and Background operations. This affects how throttling behaves.
| Operation Type | Examples | Throttle Response | User Impact |
|---|---|---|---|
| Interactive | Power BI report loads, SQL queries (ad hoc), Direct Lake queries, notebook cell executions triggered by a user | Requests are queued, then either served slowly or rejected with a 429 error if severe overload | Directly visible — report loads slowly or shows error |
| Background | Scheduled Spark jobs, pipeline runs, scheduled Power BI refreshes, Dataflow Gen2 runs, OPTIMIZE/VACUUM operations | Jobs are delayed (queued for future execution windows) rather than immediately throttled | Not immediately visible — data may be stale, pipeline finishes late |
4.3 The Smoothing Algorithm (Bursting)
Microsoft Fabric does not enforce your capacity limit in real-time at the millisecond level. Instead, it uses a smoothing algorithm that averages CU consumption over a rolling window — typically 24 hours for background workloads and shorter windows for interactive operations.
This means your capacity can legitimately burst above its nominal CU rate for short periods. An F8 running 8 CUs continuously can briefly absorb a 20 CU Spark job without immediately throttling, because the 24-hour smoothing window shows average utilization well below the 8 CU rate. The burst headroom depends on how much available CU "credit" has accumulated during quiet periods.
When you exhaust the smoothing buffer — typically from sustained high utilization over many hours — background operations begin queuing first, and interactive operations are throttled second. Understanding this hierarchy is why adding one large scheduled Spark job can suddenly make Power BI dashboards slow: the Spark job has consumed the smoothing credit, so the next interactive Power BI query has no headroom.
4.4 CU Consumption by Workload Type
| Workload | Typical CU Range | Peak Duration | Notes |
|---|---|---|---|
| Spark Notebook (small) | 4–16 CUs | Minutes | <10GB data, basic transformations |
| Spark Notebook (large) | 32–256 CUs | Hours | 100GB+ data, complex joins, window functions |
| Power BI Report Load | 0.5–2 CUs | Seconds | Direct Lake; higher for Import refresh |
| Semantic Model Refresh | 4–32 CUs | Minutes | Import mode; Direct Lake framing is much lower |
| Warehouse SQL Query | 2–8 CUs | Seconds–minutes | Per concurrent query; scales with data volume |
| Data Factory Pipeline | 1–8 CUs | Minutes–hours | Copy Activity + orchestration overhead |
| Dataflow Gen2 | 2–16 CUs | Minutes | Power Query M expressions; depends on source volume |
| Eventstream / Real-Time | 4–16 CUs (ongoing) | Continuous | Steady-state consumption while stream is active |
4.5 A Practical CU Budget Example
A retail analytics team with this daily workload profile:
- 1 large Spark notebook at 6 AM, processing 50GB, 45 minutes, consuming ~40 CUs during that window
- 5 Power BI reports refreshed on 4-hour schedules, max 2 run concurrently = ~16 CUs at peak
- 20 report users active 9 AM–5 PM, ~1–2 CUs concurrent
- 1 Dataflow Gen2 run every 2 hours, consuming ~6 CUs for 10 minutes
Peak CU demand during morning processing window: ~40 (Spark) + 16 (refreshes) + 2 (interactive) + 6 (Dataflow) = ~64 CUs peak demand. An F32 would struggle at this peak. An F64 handles it comfortably. But because the Spark job runs only 45 minutes a day, the 24-hour smoothed average is much lower — an F32 with smoothing might absorb the burst without sustained throttling. The Capacity Metrics App tells you exactly how close you are to the limit.
5. Complete F-SKU Breakdown
Microsoft Fabric offers 11 capacity tiers, from F2 to F2048. Each doubles in CU count from the previous tier. Below is a detailed breakdown of each SKU with practical guidance on who should use it and what workloads it supports.
F2 — The Exploration Tier
| CUs | 2 Capacity Units |
| Est. PAYG Monthly | ~$262/month (US East) |
| Reserved 1-Year | ~$165/month (~37% saving) |
| Direct Lake Row Limit | ~300M rows per table |
| Typical BI Users | 1–5 (non-concurrent) |
Who should use F2: Individual developers building proofs of concept, students preparing for DP-600 or DP-700 who need a real Fabric environment, small teams evaluating the platform.
What works well: Individual Spark notebooks on small datasets under 5GB, basic Lakehouse exploration, Dataflows Gen2 on small sources, a few Power BI reports with lightweight data models.
What doesn't work: Any concurrent workloads, large Spark jobs, production pipelines with SLA requirements, datasets over 300M rows in Direct Lake, more than one or two simultaneous report users.
F4 — The Small Team Tier
| CUs | 4 Capacity Units |
| Est. PAYG Monthly | ~$524/month |
| Reserved 1-Year | ~$330/month |
| Direct Lake Row Limit | ~300M rows per table |
| Typical BI Users | 5–15 (light usage) |
Who should use F4: Small startups with a single data engineer and a handful of analysts. Development environments for teams whose production runs on F16+. Power BI deployments migrating from Premium Per User with light usage patterns.
What works well: A simple Medallion pipeline with daily batch processing, 2–3 Dataflows Gen2, 5–10 Power BI reports with up to 10 concurrent users, a basic Warehouse with T-SQL queries for small team reporting.
F8 — The Development and SMB Production Tier
| CUs | 8 Capacity Units |
| Est. PAYG Monthly | ~$1,048/month |
| Reserved 1-Year | ~$661/month |
| Direct Lake Row Limit | ~1 billion rows per table |
| Typical BI Users | 15–40 (moderate usage) |
Who should use F8: Small-to-medium companies with 1–2 data engineers and 20–40 business users. Microsoft Partners building customer PoCs. Teams migrating from Power BI Premium P1 with moderate analytical workloads.
What works well: Full Medallion Architecture, Spark notebooks processing up to 50GB datasets, 10–15 Power BI reports with scheduled refreshes, a Fabric Warehouse with concurrent SQL users, basic Mirroring from a single Azure SQL source.
F16 — The Mid-Market Tier
| CUs | 16 Capacity Units |
| Est. PAYG Monthly | ~$2,097/month |
| Reserved 1-Year | ~$1,322/month |
| Direct Lake Row Limit | ~3 billion rows per table |
| Typical BI Users | 40–100 (moderate) |
Who should use F16: Mid-market companies with multiple data engineering and analytics teams sharing a platform. Organizations running moderately complex Spark ETL alongside active Power BI usage during business hours. Teams that find F8 is being consistently throttled at peak but don't need a full F32.
F32 — The Serious Production Tier
| CUs | 32 Capacity Units |
| Est. PAYG Monthly | ~$4,194/month |
| Reserved 1-Year | ~$2,644/month |
| Direct Lake Row Limit | ~6 billion rows per table |
| Typical BI Users | 100–200 |
Who should use F32: Growing enterprises with active data engineering pipelines and a meaningful Power BI user base. Organizations with multi-domain Lakehouse architecture. Retail and logistics companies with daily batch plus continuous monitoring workloads. A manufacturing company with 150 analysts, 8 Spark pipelines running overnight, and 40 reports accessed during shift changes fits comfortably on F32.
F64 — The Enterprise Standard
| CUs | 64 Capacity Units |
| Est. PAYG Monthly | ~$8,388/month |
| Reserved 1-Year | ~$5,285/month |
| Direct Lake Row Limit | Unlimited (Enterprise) |
| Typical BI Users | 200–600 |
Why F64 is the enterprise standard: F64 is the first tier that removes Direct Lake row limits, provides meaningful Spark parallelism for production data engineering, and can sustain 400–600 concurrent report users during peak hours. It's also where the Reserved Capacity math becomes compelling: at ~$5,285/month with a 1-year reservation, F64 costs far less than the equivalent Power BI Premium P2 + Synapse Spark + ADLS Gen2 stack that often runs $12,000–$18,000/month.
Who should use F64: Division-level analytics platforms at large enterprises, Microsoft Partners building managed service offerings, healthcare organizations processing large clinical datasets, financial institutions running daily batch plus continuous reporting.
F128, F256, F512, F1024, and F2048
| SKU | CUs | PAYG/Month | Reserved 1-Yr | Typical Users |
|---|---|---|---|---|
| F128 | 128 | ~$16,776 | ~$10,570 | 600–1,500 |
| F256 | 256 | ~$33,553 | ~$21,139 | 1,500–3,000 |
| F512 | 512 | ~$67,107 | ~$42,278 | 3,000–7,000 |
| F1024 | 1,024 | ~$134,214 | ~$84,555 | 7,000–15,000 |
| F2048 | 2,048 | ~$268,428 | ~$169,110 | 15,000+ |
These tiers are for large enterprises running enterprise-wide Fabric platforms, organizations with heavy Spark workloads alongside high-concurrency reporting, and companies with significant Real-Time Intelligence requirements. At F128+, the architecture conversation shifts from "will this fit in our capacity?" to "how do we partition workloads across capacities to isolate critical workloads from development noise?" At these scales, the procurement process typically involves Enterprise Agreement negotiations with Microsoft, with additional volume discounts of 15–25% beyond published reserved rates.
6. Pricing Examples: Real-World Cost Calculations
Example 1: Startup Analytics Team
SaaS startup, 8 employees, one data analyst, basic BI needs
- 5 Power BI dashboards, 5 users, daily refresh
- One Lakehouse ingesting from Salesforce and PostgreSQL via Dataflow Gen2
- No Spark workloads — Dataflows Gen2 only
Recommended: F4 | Reserved 1-Year: ~$330/month | Storage: ~$2/month | Total: ~$332/month
Example 2: Regional Retail Company
250 stores, 80 report users, 3 data engineers
- Full Medallion Architecture with 2 Spark notebooks running nightly (2 hours each), 30 Power BI reports refreshed 4x daily, 50 concurrent users at midday, hourly pipeline from ERP, 100GB storage
Cost: F32 Reserved (~$2,644) + Storage ($2.30) = ~$2,646/month
Equivalent legacy cost (ADLS + Synapse + PBI Premium P1 + ADF): ~$6,500/month. Fabric saves ~60%.
Example 3: Mid-Size Bank
Regional bank, 400 analysts, compliance-heavy, 3 domains
- Mirroring from Azure SQL and Cosmos DB, 8 Spark notebooks daily, 60 Power BI reports, 300 active business-hours users, Real-Time Intelligence for fraud monitoring, 1TB storage
F64 Reserved (~$5,285) + Storage ($23) = ~$5,308/month
Example 4: Global Manufacturing Enterprise
50 plants, 1,500 analysts, 3 regions (Europe + APAC + Americas)
- 30 Spark notebooks nightly processing 500GB+ IoT sensor data, 200+ Power BI reports, 1,200 concurrent global users, streaming telemetry from 50,000 sensors, 10TB storage per region
Architecture: F256 per region (3 regions) + F16 Dev per region:
3 × $21,139 + 3 × $1,322 + Storage ($690) = ~$68,073/month
7. Capacity Planning Framework
7.1 The Five-Factor Sizing Framework
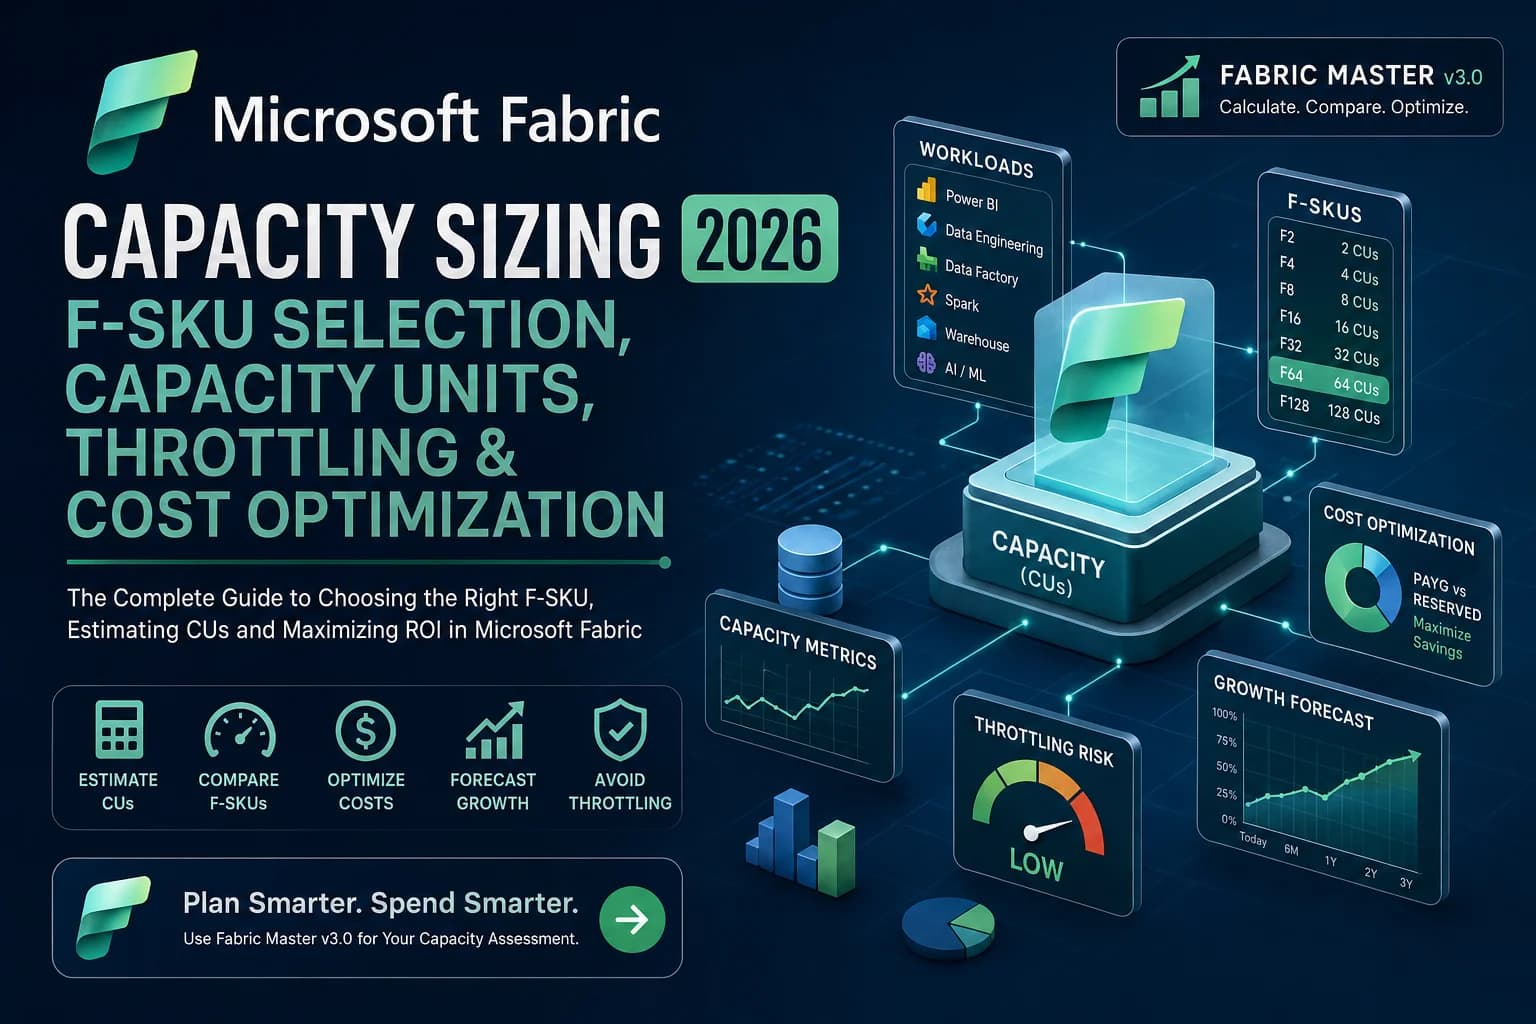
Use these five factors to estimate your capacity need. Score each factor and sum to get an approximate CU target. For a comprehensive deep dive into sizing F-SKUs and navigating Microsoft's throttling algorithms, read our dedicated guide on Fabric capacity sizing:
| Factor | Low | Medium | High |
|---|---|---|---|
| Concurrent BI Users (peak hour) | <25 → 2–4 CU | 25–100 → 8–16 CU | 100–500 → 32–64 CU |
| Spark / Data Engineering | None/light → 0–4 CU | Daily batch ≤50GB → 8–16 CU | Daily batch >50GB or concurrent → 32–128 CU |
| Semantic Model Refreshes | 1–5 models, daily → 2–4 CU | 5–20 models, 4x daily → 8–16 CU | 20+ models, hourly → 16–32 CU |
| Warehouse / SQL Workloads | None → 0 CU | 1–10 concurrent queries → 4–8 CU | 10+ concurrent queries → 16–32 CU |
| Real-Time / Streaming | None → 0 CU | Low-volume Eventstream → 4–8 CU | High-volume streaming + Eventhouse → 16–64 CU |
Sum your five CU estimates and add a 30% buffer for growth and unexpected bursts, then round up to the next F-SKU. This gives you a starting point — the Capacity Metrics App will tell you within 2–4 weeks whether you've sized correctly.
7.2 Estimating User Capacity
What matters is peak concurrency — how many users are actively loading or interacting with reports at the same time. In most enterprise environments, only 15–25% of total licensed users are active at peak hour. A 1,000-user organization typically has 150–250 concurrent users at its busiest time. For Direct Lake semantic models, each report load triggers a framing operation consuming 0.5–2 CUs for a few seconds. Under very high concurrency (300+ simultaneous loads), the aggregate CU demand spikes significantly. An F64 comfortably handles 400–600 users during peak hour with well-optimized semantic models.
7.3 Storage Planning
OneLake storage at ~$0.023/GB/month is usually a minor cost. However, poorly managed Delta tables accumulate old Parquet files from time-travel history, ballooning storage unexpectedly. Run VACUUM with a 7–30 day retention window to keep storage predictable. V-Ordered Parquet files achieve 20–40% better compression than unoptimized Parquet, directly reducing storage costs.
8. Real Enterprise Scenarios
8.1 Manufacturing: IoT + ERP Analytics
A European automotive parts manufacturer deployed Fabric to unify IoT sensor data from 12 plants with SAP ERP data. Three domains: Manufacturing Quality (sensor telemetry), Finance (ERP cost data), and Supply Chain. One F64 for Production, one F16 for Dev/Test. The manufacturing quality domain ingests 200,000 sensor readings per hour via Eventstream, routing to an Eventhouse for real-time anomaly detection. Nightly Spark jobs process the day's sensor archive into Silver Delta tables. The key cost optimization: 8 Spark notebooks running concurrently from 11 PM to 3 AM (when zero Power BI users are active) are absorbed within the F64's 24-hour smoothing window, so interactive report performance during business hours is never affected. Total cost: ~$6,619/month.
8.2 Healthcare: Clinical Data Analytics
A regional hospital network across 8 facilities needed a HIPAA-compliant analytics platform. They chose F32 with separate workspaces for Clinical Operations (PHI data, restricted) and Research (de-identified data, broader access). OneLake Data Access Roles enforce table-level access control — research analysts can only see de-identified Silver tables, not raw PHI Bronze data. Mirroring from Azure SQL Database provides near-real-time patient census data without custom ETL. Total cost: ~$3,351/month.
8.3 Retail: High-Concurrency BI
A national grocery chain needed to replace a fragile SSAS + SSRS stack serving 450 store managers. The Monday morning peak — all 450 managers loading the weekly dashboard between 8 AM and 9 AM — required F64, validated through load testing. The F32 they initially considered reached 95% CU utilization and throttled 15% of users. Cost optimization: from Tuesday through Sunday, peak drops to 50–80 users. They dynamically resize to F16 on Tuesday morning and back to F64 Sunday night using the Fabric API, saving approximately 30% of monthly capacity cost while maintaining Monday SLAs.
8.4 Banking: Multi-Domain FinOps Platform
A mid-size bank with $8B AUM deployed Fabric as a unified risk and finance analytics platform on a single F128 capacity with 6 domains, replacing separate Teradata DW, Oracle Analytics, and managed Databricks. The FinOps team implemented full chargeback: workspace CU consumption is allocated back to business units monthly based on Capacity Metrics App data. The Risk team's heavy Spark workloads made them the largest cost center — they voluntarily moved Monte Carlo simulation jobs to 2 AM to reduce their chargeback allocation.
8.5 Government: High-Availability Reporting
A government statistics agency migrated national economic data reporting to Fabric with a 99.9% availability requirement. Rather than one F64, they run two F32 capacities in active-active configuration — Production Workspace on Capacity A, standby on Capacity B. If Capacity A experiences unexpected throttling, an administrator reassigns the public reporting workspace to Capacity B within minutes via the Fabric Admin Portal, without data loss (since data lives in OneLake, not in the capacity).
9. Microsoft Fabric vs Power BI Premium
| Dimension | Power BI Premium (P-SKU) | Microsoft Fabric (F-SKU) |
|---|---|---|
| Compute model | BI-only compute pool (v-cores) | Unified CU pool for all workloads |
| Spark / Data Engineering | ❌ Not included | ✅ Included in same CU pool |
| Data Warehouse | ❌ Not included | ✅ Included |
| Real-Time Intelligence | ❌ Not included | ✅ Included |
| Direct Lake mode | ✅ (via Fabric workspace) | ✅ Native |
| P1 equivalent PAYG monthly | ~$4,995/month | F64 ~$8,388 (but includes Spark + Warehouse + RTI) |
| P1 Reserved 1-year | ~$4,161/month | F64 ~$5,285/month (full platform) |
| Roadmap | New features shipping exclusively to Fabric F-SKUs | Active development, all new features land here first |
For organizations on Power BI Premium Per User (PPU) at $20/user/month: at 50+ users, a Fabric F8 Reserved ($661/month) is more cost-effective than PPU ($1,000/month for 50 users) while providing Spark, Warehouse, and Lakehouse capabilities that PPU doesn't offer.
10. Microsoft Fabric vs Azure Synapse Analytics
| Dimension | Azure Synapse Analytics | Microsoft Fabric |
|---|---|---|
| SQL Compute billing | Per DWU (dedicated pool) or per TB scanned (serverless) | CU-based, shared with all workloads |
| Spark billing | Per vCore-hour (separate from SQL) | Same CU pool as everything else |
| Storage | ADLS Gen2 (separate billing) + Synapse DW storage | OneLake ($0.023/GB/month, single storage) |
| Typical enterprise cost (medium co) | $8,000–$15,000/month (SQL + Spark + ADLS + PBI P1) | $3,000–$6,000/month (equivalent F64 Reserved + storage) |
| Migration complexity | N/A (incumbent) | Medium — Spark notebooks port with minor changes; T-SQL largely compatible; ADF pipelines recreated in Fabric Data Factory |
The direction of development is clear: every new data platform feature ships to Microsoft Fabric first. For new deployments in 2026, Fabric is the standard recommendation. For existing Synapse customers, migration timelines vary — simple Spark + SQL workloads can migrate in weeks; complex Dedicated SQL Pool architectures may take 6–12 months.
11. Microsoft Fabric vs Databricks
| Dimension | Databricks | Microsoft Fabric |
|---|---|---|
| Spark maturity | Industry-leading. Databricks created Apache Spark; Photon engine delivers 2–4× better performance vs open-source Spark | Good. Fabric Spark is open-source Spark 3.x. Strong for most enterprise workloads but trails Photon for CPU-intensive transforms |
| Power BI / BI integration | Possible via Databricks SQL Warehouse + Power BI DirectQuery, but requires additional configuration and licensing | Native. Power BI Direct Lake is the most performant BI-on-lakehouse integration available anywhere |
| SaaS simplicity | PaaS — requires cluster management, instance types, autoscaling configuration, security group setup | SaaS — no cluster management, no instance types, no infrastructure configuration required |
| Typical cost (F64-equivalent) | $15,000–$25,000/month (Spark + SQL Warehouse + ADLS + PBI Premium) | $5,285/month (F64 Reserved includes everything) |
| Best for | Data science-heavy teams, MLOps-mature orgs, very large-scale Spark ETL (>100TB daily), multi-cloud, deep Spark expertise | Microsoft-ecosystem orgs, Power BI-centric enterprises, teams needing SaaS simplicity, mixed BI + engineering, cost-sensitive deployments |
A notable 2026 trend: enterprises running a Databricks + Fabric hybrid. Databricks handles large-scale ML training and complex Spark ETL, writing results as Delta tables to ADLS Gen2. Fabric shortcuts into those same Delta files via OneLake Shortcuts. Power BI Direct Lake queries the Databricks-managed Delta tables. This hybrid approach maximizes the strengths of both platforms.
12. Cost Optimization Strategies
12.1 Reserved Capacity — The #1 Lever
| SKU | PAYG/Month | 1-Year Reserved | 3-Year Reserved | Annual Saving (1-yr) |
|---|---|---|---|---|
| F8 | $1,048 | $661 | ~$504 | $4,644/year saved |
| F32 | $4,194 | $2,644 | ~$2,015 | $18,600/year saved |
| F64 | $8,388 | $5,285 | ~$4,030 | $37,236/year saved |
Recommended approach: Run on pay-as-you-go for 2–4 weeks in production to validate your SKU choice using the Capacity Metrics App. Once confident in the SKU, purchase a 1-year Reserved Capacity. Reserve only the SKU you run 24/7.
12.2 Pause and Resume
Fabric capacities can be paused via the Azure Portal, Fabric Admin Portal, or REST API. When paused, no compute charges accrue. All OneLake data persists — you continue paying storage charges only. For development capacities running only business hours: an F8 PAYG at $1,048/month 24/7 costs only ~$335/month when limited to 10 hours/day × 5 days/week. Use Azure Automation or Logic Apps to schedule pause/resume automatically.
12.3 Workload Scheduling
Scheduling is free. It costs nothing to move a pipeline from 9 AM to 3 AM. Heavy background operations (Spark jobs, large Dataflow Gen2 runs, OPTIMIZE/VACUUM) should run during hours when interactive users are inactive. For US companies, that's overnight. This single change eliminates throttling for many organizations without any capacity upgrade.
12.4 Direct Lake vs Import Mode
A large semantic model refresh (100M rows, 15 tables) in Import mode might consume 20–30 CUs for 15–30 minutes, scheduled 4× daily. The equivalent Direct Lake framing operation typically consumes 2–5 CUs for 30–60 seconds — a 95%+ reduction. Migrating semantic models backed by Delta tables from Import to Direct Lake frequently reduces total capacity utilization enough to drop one SKU tier.
12.5 Delta Optimization (V-Order, OPTIMIZE, VACUUM)
- V-Order: Applied automatically by Fabric engines during writes. Verify with
spark.conf.get("spark.sql.parquet.vorder.enabled"). Without V-Order, Direct Lake query performance degrades significantly. - OPTIMIZE: Compacts small Parquet files. An unoptimized table with 10,000 files might take 10× more CUs to scan than the same data in 20 optimized files. Run weekly on frequently updated tables.
- VACUUM: Removes Parquet files no longer referenced by the Delta log. Default 7-day retention is reasonable:
VACUUM table_name RETAIN 168 HOURS.
12.6 Workload Isolation with Multiple Capacities
At F64+ scale, splitting workloads across multiple smaller capacities provides isolation guarantees that a single large capacity cannot offer. Example: Production BI Capacity (F32) hosts only Power BI workspaces; Data Engineering Capacity (F32) hosts Lakehouse, Warehouse, Spark notebooks; Real-Time Capacity (F8) hosts Eventstream and Eventhouse. Engineers can run heavy jobs without impacting BI users. The premium over a single F64 is small (~$949/month more) but the SLA guarantees are invaluable for organizations with strict reporting availability requirements.
13. Fabric FinOps: Governance, Chargeback, and Cost Accountability
13.1 Establishing Visibility, Accountability, and Governance
Visibility: Use the Capacity Metrics App to track CU consumption per workspace, per workload type, and over time. Export this data to a Fabric Lakehouse and build a cost allocation dashboard in Power BI showing each team's monthly CU consumption as a percentage of total capacity.
Accountability: Assign workspace owners. Every workspace should have a named owner who receives monthly reports on their workspace's CU consumption and is responsible for optimizing underperforming workloads.
Governance: Set workspace-level CU limits in the Fabric Admin Portal. A workspace exceeding its allocated CU budget triggers a notification (or in strict enforcement, throttling) before it impacts other workspaces.
13.2 Showback vs Chargeback
- Showback: Calculate each team's share of monthly Fabric capacity cost and show them the number — but don't actually bill their budget. Creates awareness without requiring complex internal accounting. The right starting point for most organizations.
- Chargeback: Each team's cost center is actually billed for their Fabric consumption share. Requires integration between Capacity Metrics App data and your financial management system. Appropriate once consumption patterns are stable.
13.3 FinOps KPIs for Fabric
| KPI | Definition | Target |
|---|---|---|
| Average CU Utilization | Average CU consumption as % of capacity over 30 days | 50–75% (headroom for bursts) |
| Peak CU Utilization | Maximum CU consumption in any 5-minute window | <85% (above 90% triggers throttling risk) |
| Throttle Incident Rate | Number of throttling events per month | Zero for interactive workloads |
| Cost Per Active User | Monthly capacity cost / monthly active Power BI users | <$30/user/month |
| Reserved Coverage % | % of compute spend covered by Reserved Capacity | >80% (minimize PAYG exposure) |
| Off-Hours Idle Cost | % of monthly spend on non-production capacities during off-hours | <5% (most off-hours dev capacity should be paused) |
14. Capacity Monitoring
14.1 The Fabric Capacity Metrics App
The Microsoft Fabric Capacity Metrics App is a Power BI app published by Microsoft that connects to your Fabric capacity's telemetry data. Every Fabric administrator should install it on day one. Go to AppSource, search "Microsoft Fabric Capacity Metrics," install, and connect to your capacity ID.
Key pages in the Metrics App:
- Overview: 14-day CU utilization trend, total throttling events, capacity health score. The first page you open when investigating a performance complaint.
- Multi-Metric Ribbon Chart: Interactive vs background CU consumption over time. When the interactive (orange) ribbon spikes, users are experiencing slowdowns.
- Item Detail: Drills down to individual Fabric items and shows their CU consumption by operation. This is how you identify the "expensive" workloads.
- Timepoint Explorer: Pick any specific minute and see exactly what was running on the capacity at that instant. Invaluable for root-cause analysis of throttling incidents.
14.2 Monitoring via REST API
GET https://api.fabric.microsoft.com/v1/capacities/{capacityId}/operations

# Returns capacity operation history including:
# - Operation type (Interactive / Background)
# - Duration in seconds
# - CU seconds consumed
# - Status (Completed / Throttled / Rejected)
# - Workspace and item that triggered the operation
Export this data nightly to a Fabric Lakehouse and build a Power BI report on top — this becomes your organization's custom FinOps dashboard with far more detail than the out-of-the-box Metrics App provides. Use a Fabric Reflex alert on a KQL query that fires when interactive CU utilization exceeds 80% for more than 10 consecutive minutes, posting a Teams message to the platform engineering channel.
15. The 25 Most Common Fabric Pricing Mistakes
- Sizing by user count alone. Licensing headcount tells you nothing about concurrent CU demand. Peak concurrency, not total users, drives the sizing decision. 200 users who all open dashboards at 9:00 AM Monday need far more capacity than 200 users with staggered patterns.
- Forgetting that Spark is a CU monster. A single Spark notebook processing 100GB can consume as many CUs in 2 hours as 500 Power BI report loads. Teams adding Spark ETL to an existing BI-only deployment without resizing are almost always shocked by throttling.
- Committing to Reserved Capacity too early. Reserving an F64 before running 4 weeks in production often results in locking into the wrong SKU. One enterprise reserved an F128 after a PoC, then discovered their workloads comfortably fit in F64 — costing $60,000+ extra per year.
- Running dev/test capacities 24/7 without pausing. Development workloads run during business hours. An F16 dev capacity running 24/7 costs ~$2,097/month. Running it only 50 hours/week reduces effective cost to ~$625/month. Implement pause automation on day one.
- Not installing the Capacity Metrics App. You cannot optimize what you cannot see. Teams that skip the Metrics App fly blind, adding capacity whenever they experience throttling without understanding whether scheduling changes would have solved it.
- Running OPTIMIZE and VACUUM during business hours. These background operations consume meaningful CUs. Running OPTIMIZE on a large table while users load dashboards is a common cause of unexplained afternoon slowdowns.
- Keeping Power BI semantic models in Import mode unnecessarily. Any semantic model backed by Delta tables in a Lakehouse or Warehouse should be evaluated for Direct Lake migration. The CU savings from eliminating scheduled refreshes frequently justify the migration engineering effort within one billing cycle.
- Ignoring V-Order on existing tables. Tables created before V-Order was standard are not V-Ordered. Running OPTIMIZE rewrites files with V-Order, dramatically improving Direct Lake query performance and reducing per-query CU consumption.
- Assigning Real-Time Intelligence to the same capacity as batch and BI. Eventstream and Eventhouse are continuous consumers. Isolate streaming workloads on a dedicated capacity to prevent constant background noise from affecting interactive BI performance.
- Misunderstanding the smoothing algorithm as "free bursting." Sustained overutilization depletes the smoothing credit and triggers throttling, often at the worst possible moment — Monday morning report loads after a weekend of pipeline backlog.
- Not separating production and development workspaces across different capacities. A data engineer testing a Spark notebook that runs for 3 hours and consumes 80% of CUs directly degrades production dashboard performance for all users. Separation eliminates this risk.
- Buying multiple small capacities when one larger is cheaper. Three F8 capacities (3 × $1,048 = $3,144/month PAYG) cost more than one F32 ($4,194/month) while providing less combined burst headroom. Consolidate small capacities where isolation isn't needed.
- Using Dataflows Gen2 for large-scale transformations. Dataflows Gen2 is ideal for medium complexity Power Query M transformations. For high-volume transformations (50GB+), Spark notebooks are more CU-efficient because they parallelize across the cluster.
- Not implementing efficient RLS on high-cardinality fact tables. Poorly designed row-level security that forces a full table scan on every report load multiplies the CU cost per query by 10–100×. Design RLS using fact-table-level filters on properly indexed columns.
- Neglecting VACUUM and accumulating massive Delta storage. Without regular VACUUM runs, old Parquet files accumulate indefinitely. A table holding 100GB of current data might store 500GB of historical versions. At enterprise scale with hundreds of tables, this becomes significant unnecessary cost.
- Treating Fabric storage as negligible without tracking growth. OneLake grows silently. Without monitoring, a team can accumulate terabytes of unneeded files over months. Implement a monthly storage growth report.
- Skipping partition strategy on large Delta tables. An unpartitioned 1TB fact table queried by date range forces a full scan on every query. A table partitioned by year/month skips 95% of files for typical queries, reducing CU consumption proportionally.
- Running interactive SQL queries directly against the Bronze Lakehouse. Bronze data contains raw, unoptimized files. Every analyst who queries Bronze instead of Silver or Gold generates expensive scans consuming disproportionate CUs and producing unreliable results.
- Assuming all regions cost the same. Fabric pricing varies by Azure region by 15–30%. Multi-region deployments should calculate costs per region rather than using a single global figure.
- Not tagging capacities with cost center information. Without resource tags, Azure Cost Management shows Fabric capacity charges as a single undifferentiated line item. Apply tags (cost-center, environment, domain) at provisioning time.
- Building complex semantic models against Bronze Lakehouse data. Bronze data is raw and large. Gold-layer aggregated Delta tables are optimized for consumption. Always connect semantic models to Gold-layer data.
- Ignoring the DirectLakeBehavior property. Left at the default (AlwaysFallback), a Direct Lake model that exceeds memory silently falls back to DirectQuery mode. Set to DirectLakeOnly and configure alerting on fallback events so you know when memory limits are being hit.
- Not negotiating Enterprise Agreement pricing for large commitments. Published list prices are the starting point, not the final price. Enterprises with annual Fabric spend above $500,000 should engage their Microsoft account team for EA pricing — additional 10–25% discounts are available.
- Over-architecting for current workload while ignoring growth. Building an F256 platform for a workload that currently needs F32 "to leave room for growth" ties up capital unnecessarily. Start right-sized, use the Metrics App to track trends, and scale up when utilization consistently approaches 70–80%.
- Not reading the OneLake storage billing details carefully. OneLake charges for data storage plus data transactions (reads and writes). For workloads with very high transaction volume, transaction charges can become non-negligible. Monitor both storage and transaction costs in Azure Cost Management monthly.
16. Frequently Asked Questions
Pricing Basics
Q1: How much does Microsoft Fabric cost?
Fabric capacity ranges from ~$262/month (F2, PAYG, US East) to ~$268,428/month (F2048). Most production deployments use F32–F128 at $4,194–$16,776/month PAYG or $2,644–$10,570/month with 1-year Reserved Capacity. Storage is additional at ~$0.023/GB/month.
Q2: What is included in the Fabric capacity price?
The capacity price covers all compute workloads: Lakehouse (Spark), Data Warehouse (SQL), Data Factory (pipelines, Dataflows Gen2), Power BI (refresh, rendering), Data Science (notebooks, experiments), Real-Time Intelligence (Eventstream, Eventhouse, Reflex), and Mirroring. OneLake storage is billed separately.
Q3: Do I need Power BI Premium licenses separately from Fabric?
No. F-SKU capacities include all Power BI Premium features. Users consuming content from a workspace on Fabric capacity need either a Microsoft Fabric Free license (for read-only report consumption) or a Power BI Pro/PPU license (for creating and publishing content).
Q4: What is the cheapest way to use Microsoft Fabric?
The Fabric Free Trial provides 60 days of access at no cost. After the trial, F2 at ~$262/month PAYG or ~$165/month with a 1-year reservation is the lowest cost entry. Pausing the capacity when not in use reduces effective monthly cost significantly.
Q5: How does Fabric pricing compare to Databricks?
Fabric tends to be significantly less expensive for workloads that combine BI (Power BI) with data engineering (Spark). A comparable Databricks + Power BI Premium stack typically costs 2–3× more than the equivalent Fabric F-SKU for mid-market deployments.
Q6: Is Microsoft Fabric billed monthly or annually?
Pay-as-you-go Fabric capacity is billed hourly and appears on your Azure monthly invoice. Reserved Capacity is paid upfront for 1 or 3 years (or monthly installments for 1-year reservations at some tiers). Storage is billed monthly based on consumption.
Q7: Can I try Microsoft Fabric for free?
Yes. Microsoft offers a 60-day free Fabric trial providing access to all Fabric workloads on a shared trial capacity. For any production validation, a paid capacity is strongly recommended.
Capacity Units and SKUs
Q8: What is the difference between an F-SKU and a P-SKU?
P-SKUs (P1–P5) were Power BI Premium capacity tiers, now legacy. F-SKUs (F2–F2048) are the Microsoft Fabric capacity tiers that replace them. F-SKUs include all P-SKU features plus Spark, Warehouse, Lakehouse, Real-Time Intelligence, and OneLake access. Always buy F-SKU for new deployments.
Q9: What does a Capacity Unit (CU) actually represent?
A CU is Microsoft's normalized compute unit for Fabric. It abstracts the underlying CPU, memory, and I/O resources into a single measurement. An F8 capacity provides 8 CUs of concurrent compute. Every workload consumes CUs at some rate — a Spark job might consume 32 CUs for 30 minutes; a Power BI report load might consume 1 CU for 2 seconds.
Q10: Can I have multiple capacities in one Fabric tenant?
Yes. You can provision multiple F-SKU capacities within a single Fabric tenant. Each capacity operates independently with different CU pools and different billing. This is standard practice for large enterprises: separate Production and Development capacities, or separate capacities by geographic region or business domain.
Q11: Can I assign multiple workspaces to the same capacity?
Yes, and this is the recommended approach. A single F64 capacity can host hundreds of workspaces. All workspaces share the 64 CU pool. The Capacity Metrics App shows the breakdown of CU consumption by workspace.
Q12: What happens if my capacity runs out of CUs?
Microsoft applies a smoothing algorithm rather than a hard real-time limit. If sustained usage exceeds capacity limits, background operations are delayed first, then interactive operations are throttled. Users see slow reports or error messages; data engineers see delayed pipeline completions.
Q13: Can I scale my Fabric capacity up or down?
Yes. You can change the SKU of a running Fabric capacity in the Azure Portal or Fabric Admin Portal. Scaling up takes a few minutes. Data in OneLake is unaffected by capacity changes. Reserved Capacity reservations are for a specific SKU — changing SKU breaks the reservation.
Q14: What is the Direct Lake row limit for each SKU?
F2 and F4 support approximately 300M rows per table; F8 supports ~1 billion rows; F16 supports ~3 billion; F32 supports ~6 billion. F64 and above have no documented row limits. Organizations with tables above these limits need to either upgrade SKUs or implement table partitioning strategies.
Q15: What is the minimum SKU for production use?
There is no hard minimum. In practice, most production deployments start at F8 for small teams and F32–F64 for enterprise deployments. F2 and F4 are best reserved for development, exploration, and PoC scenarios.
Reserved Capacity and Cost Optimization
Q16: How much do I save with Reserved Capacity?
Approximately 37% for a 1-year commitment and 52% for a 3-year commitment compared to pay-as-you-go. On an F64, this translates to over $37,000/year saved with a 1-year reservation.
Q17: What happens if I need to cancel my Reserved Capacity?
Microsoft Reserved Capacity follows Azure Reservations policies. You can cancel with a prorated refund within the first 7 days. After 7 days, cancellation is generally not available. Exchanges (changing to a different SKU reservation) may be possible — check current Azure Reservations policy at time of purchase.
Q18: Should I pause and resume capacity or keep it running 24/7?
For production capacities serving users in a single timezone, pausing overnight and on weekends saves 40–60% of monthly compute costs. For all non-production capacities, pause automation is strongly recommended. Use Azure Automation or Logic Apps to schedule pauses automatically.
Q19: Can I reserve capacity at one SKU and run at a higher SKU during peak periods?
Reservations apply to a specific SKU. If you reserve F32 but scale up to F64 for a peak period, you pay PAYG rates for the F64 during that period. Some organizations use this deliberately: reserve the base SKU, scale up temporarily for seasonal peaks.
Q20: Does Microsoft offer enterprise pricing discounts beyond Reserved Capacity?
Yes, through Microsoft Enterprise Agreements. Organizations with annual Azure committed spend above certain thresholds can negotiate additional discounts through their Microsoft account team — typically 10–25% below published reserved rates for large commitments.
User Licensing
Q21: Do report viewers need a Power BI Pro license with Fabric?
When a workspace is assigned to Fabric capacity, users who only view Power BI reports can use the free Microsoft Fabric license — no Pro license required. Report creators and people who publish content still need Power BI Pro, Premium Per User, or a Microsoft Fabric subscription.
Q22: How many users can access Fabric without additional user licenses?
Unlimited read-only users can access content from a Fabric capacity with the free Microsoft Fabric license. The capacity itself is the billing mechanism — adding more viewers doesn't increase cost if the capacity is large enough. This is a significant advantage over PPU.
Architecture and Technical
Q23: Can I use Fabric without OneLake?
No. OneLake is the storage foundation of Microsoft Fabric. All Fabric workloads read from and write to OneLake. You cannot use Fabric compute against external ADLS Gen2 storage accounts as the primary storage (though you can access external storage via Shortcuts).
Q24: How is OneLake storage priced?
OneLake storage is approximately $0.023/GB/month (varies by region), the same as Azure Data Lake Storage Gen2 LRS pricing. Data transaction costs are also billed similarly to ADLS Gen2. For most organizations, OneLake storage is a minor fraction of total Fabric cost.
Q25: Does Mirroring consume capacity CUs?
Yes. Mirroring continuously replicates data from source databases into OneLake and consumes CUs for the ongoing replication process. The CU consumption depends on the rate of change in the source database — a high-transaction OLTP database generates more Mirroring activity than a slowly changing reference database.
Q26: How does Direct Lake affect capacity consumption compared to Import mode?
Direct Lake framing consumes significantly fewer CUs than a full Import mode refresh. A scheduled Import refresh of a large model might take 20–30 minutes consuming 20–30 CUs; the equivalent Direct Lake framing operation takes 30–60 seconds consuming 2–5 CUs — an 80–90% reduction.
Q27: What is the Fabric Capacity API?
The Fabric REST API provides programmatic access to capacity management: pause/resume, scale up/down, workspace assignment changes, and utilization monitoring. Organizations use this API to automate capacity scheduling, build custom monitoring dashboards, and integrate Fabric metrics into enterprise observability platforms.
Q28: Can I use Fabric for embedded analytics in customer-facing applications?
Yes. Power BI Embedded is the standard mechanism for embedding Fabric reports in external applications. For embedded scenarios, you purchase an A-SKU (Azure) capacity rather than an F-SKU — the A-SKU is specifically designed for embedded use cases with different licensing terms for ISVs and customer-facing deployments.
Governance and Management
Q29: Who can manage a Fabric capacity?
Fabric capacity administrators are specified in the Fabric Admin Portal. Tenant administrators automatically have capacity admin rights. Capacity admins can assign workspaces to the capacity, monitor utilization, and manage capacity settings.
Q30: Can I set CU quotas per workspace to prevent one team from monopolizing capacity?
Yes. Fabric provides workspace-level controls that allow administrators to limit maximum CU consumption per workspace. When a workspace reaches its limit, its workloads are throttled while workloads in other workspaces continue operating. Configure these limits in the Fabric Admin Portal under workspace settings.
Q31: How do I implement chargeback for Fabric costs across business units?
Use the Capacity Metrics App or Fabric REST API to export workspace-level CU consumption data monthly. Build a cost allocation calculation that apportions the total capacity monthly cost to business units based on their workspace's share of total CU consumption. Feed this data into your internal finance system as journal entries against the appropriate cost centers.
Q32: Can I audit which users are consuming the most Fabric capacity?
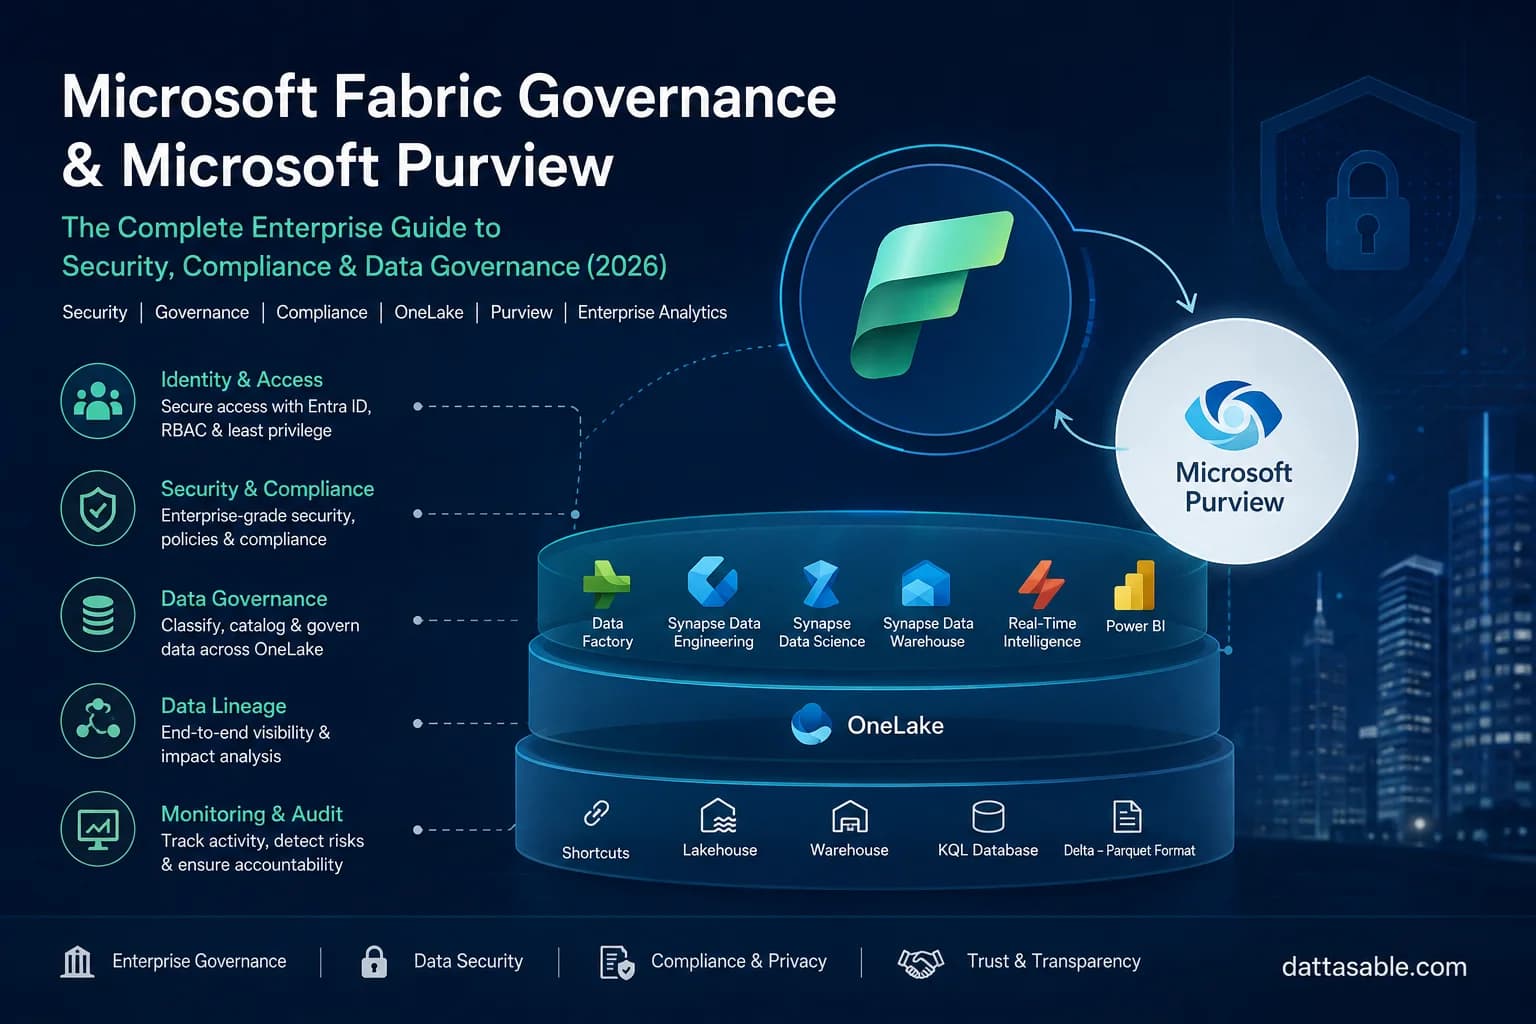
Yes. The Capacity Metrics App provides item-level granularity for CU consumption. You can identify which specific notebook executions, report loads, or pipeline runs consumed the most CUs, and trace them back to the user or service principal that triggered them. The Fabric Audit Log in Microsoft Purview provides a complementary record of all user actions.
Migration Questions
Q33: How do I migrate from Power BI Premium P1 to Fabric F-SKU?
Provision an F-SKU capacity alongside your existing P1, move workspaces one at a time from P1 to F-SKU, validate report performance and functionality, then decommission the P1. Semantic models and dashboards carry over without modification; XMLA endpoints and dataset refresh schedules continue working.
Q34: How long does migrating from Azure Synapse to Fabric take?
Simple Synapse workloads (Spark notebooks with basic transformations, straightforward SQL queries) can migrate in 2–4 weeks. Complex architectures (Synapse Link, Dedicated SQL Pools with many stored procedures) typically take 3–9 months. Plan for a parallel-run period where both platforms operate simultaneously to validate results before cutting over.
Q35: What happens to my Power BI Premium reports on Fabric?
Power BI reports on Fabric work identically to Power BI Premium. The difference is that Fabric adds Lakehouse, Warehouse, Spark, and Real-Time Intelligence alongside your existing Power BI investment. Your existing .pbix files, semantic models, and report configurations remain unchanged.
Certifications
Q36: Is Fabric capacity planning covered in the DP-600 exam?
Yes. The DP-600 exam covers workspace governance, capacity settings, and deployment pipelines as part of the "Plan and Implement Data Analytics Environments" domain (10–15% of the exam). See our DP-600 Study Guide 2026 for complete exam preparation.
Q37: Is capacity optimization covered in the DP-700 exam?
Yes. The DP-700 exam covers the Capacity Metrics App, Spark cluster optimization, and pipeline performance tuning as part of the "Monitor and Optimize Solutions" domain (15–20% of the exam). See our DP-700 Study Guide 2026 for detailed coverage.
Troubleshooting
Q38: Why are my Power BI reports slow when Spark jobs are running?
This is the most common symptom of shared capacity over-utilization. Spark jobs consume large amounts of CUs, depleting the smoothing buffer. Solutions: schedule Spark jobs during off-hours, upgrade capacity SKU, or isolate Spark workloads on a separate capacity.
Q39: Why does my Direct Lake report fall back to DirectQuery mode?
Direct Lake falls back to DirectQuery when the VertiPaq engine's memory is exhausted and column segments cannot be loaded into the in-memory cache. Solutions: upgrade to a higher SKU, reduce the number of columns in your semantic model, or run OPTIMIZE on your Delta tables to improve compression.
Q40: My pipeline is failing with a 429 error. What does this mean?
A 429 error indicates capacity is throttled and rejecting new requests after sustained overutilization depleted the smoothing buffer. Immediate fix: pause non-critical workloads to free CU headroom. Medium-term: reschedule workloads or upgrade capacity. Use the Capacity Metrics App's Timepoint Explorer to find what was consuming CUs at the time of the 429 errors.
Q41: My Fabric costs are higher than expected. Where should I look first?
Open the Capacity Metrics App → Item Detail → sort by CU Seconds descending. The top 10 items account for the majority of your cost. In most cases, a few large Spark jobs or poorly designed scheduled refreshes account for 60–80% of total CU consumption. Fix those first.
Q42: What should I do if my Fabric capacity is consistently at 90%+ utilization?
Run a 2-week analysis in the Capacity Metrics App to understand the utilization pattern. If consistently high throughout the day, you need a larger SKU. If high only during specific windows, start with scheduling optimization before upgrading — moving 2–3 large background jobs to off-peak hours often resolves sustained high utilization at a fraction of the cost of an SKU upgrade.
Q43: In which Azure subscription do Fabric costs appear?
Fabric capacity is an Azure resource in the Azure subscription it was provisioned in. All Fabric charges (capacity + OneLake storage) appear in Azure Cost Management under that subscription. Filter by resource type "Microsoft.Fabric/capacities" to see Fabric-specific charges separately from other Azure services.
Q44: Does Fabric support multi-region for disaster recovery?
Fabric capacities are provisioned in a single Azure region. For multi-region redundancy, provision separate capacities in each target region. A common approach for mission-critical workloads is active-active: two F32 capacities in separate regions, with workspace assignments switched if one capacity has issues. Since data lives in OneLake (not in the capacity), there is no data loss from capacity failover.
Q45: Can I reduce cost by using fewer workspaces?
Workspace count doesn't directly affect CU consumption — an empty workspace costs nothing in compute. Reducing the number of semantic models and Spark notebooks (by combining related workloads into fewer, more efficient items) can reduce total CU consumption. Workspace consolidation is more a governance simplification than a direct cost reduction.
Q46: How does Fabric billing handle partial months?
Pay-as-you-go Fabric capacity is billed hourly to the nearest hour. If you create a capacity mid-month and delete it before month-end, you pay only for the hours it was running. Reserved Capacity is purchased for a full year or 3 years regardless of actual usage — pausing the capacity doesn't reduce the reservation payment, only pay-as-you-go capacity benefits from the billing pause.
Q47: What is the difference between Fabric capacity and Power BI Embedded (A-SKU)?
Fabric F-SKU is for internal organizational analytics platforms. A-SKU (Azure, for Power BI Embedded) is for ISVs and customer-facing applications where you embed Power BI reports in your product for your customers. A-SKU pricing is similar to F-SKU pricing but with different licensing terms that allow non-organizational users to access content.
Q48: Is there autoscaling available for Fabric capacity?
As of mid-2026, Fabric does not have native autoscaling — you cannot configure a capacity to automatically scale from F32 to F64 during peak demand and back down afterward. The Fabric REST API can be used to build custom autoscaling logic. Native autoscaling is on the product roadmap and expected to change this in future releases.
Q49: How does the Fabric Trial differ from a purchased F2 capacity?
The Fabric Trial provides a shared capacity pool — you share compute resources with other trial users and performance is not guaranteed. A purchased F2 capacity is a dedicated capacity — you have exclusive access to 2 CUs with SLA-backed performance guarantees. For any meaningful testing or development work, a purchased F2 is strongly preferable to the shared trial.
Q50: Where should I verify current Microsoft Fabric pricing?
Always verify current pricing on the official Azure Fabric Pricing page before making procurement decisions. Prices change periodically and vary by region. The prices referenced in this guide are approximate US East rates current as of July 2026 and should be used for estimation purposes only, not for contract commitments.
17. Conclusion: Decision Tree and Final Recommendations
17.1 The SKU Selection Decision Tree
Follow this decision path to your starting SKU:
Step 1: Purpose
→ Learning/PoC only? → F2
→ Production workload? → Continue to Step 2
Step 2: Team size and concurrent users at peak hour
→ <20 users, no Spark → F4 or F8
→ 20–100 users, light Spark → F8 or F16
→ 100–300 users, active Spark → F32
→ 300–600 users, active Spark + Streaming → F64
→ 600–2,000 users, heavy multi-domain → F128 or F256
→ 2,000+ users, global enterprise → F512+
Step 3: Validate with the Metrics App
→ Run PAYG for 4 weeks → Monitor average and peak CU utilization
→ Average <50%: consider downgrade → Average >70%: plan for upgrade → Peak >85%: immediate scheduling optimization needed
Step 4: Commit to Reserved Capacity
→ Once SKU validated: purchase 1-year Reserved Capacity → Annual saving: ~37%
17.2 The Five Rules for Long-Term Cost Control
- Measure before you resize. Never upgrade a SKU without first running 2–4 weeks of Metrics App analysis. Many throttling incidents that look like "we need more capacity" turn out to be "we need to reschedule this one large pipeline."
- Separate production and development capacity. This prevents development experiments from impacting production performance, eliminates the need to run large dev capacities 24/7, and simplifies cost attribution.
- Schedule background work during off-peak hours. Pipeline runs, Spark notebooks, and OPTIMIZE/VACUUM operations should run when users are sleeping. This single discipline eliminates most throttling incidents at no cost.
- Migrate to Direct Lake wherever possible. Every Import mode semantic model on a Fabric Delta data source is costing you unnecessary CUs on every scheduled refresh. Direct Lake framing is dramatically more efficient and provides better data freshness as a bonus.
- Review the FinOps dashboard monthly. Cost awareness creates cost accountability. Teams that see their monthly CU consumption consistently optimize their workloads. Teams that never see the numbers consistently over-consume.
17.3 Where Fabric is Heading
Microsoft Fabric's development roadmap in 2026 focuses on Copilot and AI integration, autonomous capacity management, and expanded external connectivity. Copilot features consuming CUs are shipping to Fabric F-SKUs — as these features mature and adoption grows, factor AI workload CU consumption into capacity planning. Native autoscaling is on the product roadmap and will change capacity planning significantly when available: rather than sizing for peak demand and reserving headroom, organizations will be able to size for average demand and let Fabric handle peaks automatically.
The fundamental bet remains the same: Microsoft Fabric is the platform Microsoft is building toward. Power BI, Synapse, Analysis Services, and Azure Data Factory are all converging here. Understanding the Fabric pricing and capacity model today is not just a cost optimization exercise — it's building fluency in the infrastructure language of enterprise analytics for the next decade.
Your Next Steps
- Install the Fabric Capacity Metrics App if you haven't already.
- Review our OneLake Architecture Guide to understand the storage layer that everything builds on.
- Study the Medallion Architecture Guide to understand how to structure your data for maximum CU efficiency.
- Our DP-600 and DP-700 study guides cover capacity management in detail if you're preparing for certification.
- Read our Microsoft Fabric Architecture guide for a comprehensive technical foundation on the full platform.
Related Resources
- Microsoft Fabric Architecture Explained: The Complete 2026 Guide
- OneLake Architecture Guide: Delta Lake, Shortcuts, Mirroring, and Direct Lake
- Microsoft Fabric Medallion Architecture Guide
- DP-600 Study Guide 2026: Complete Exam Preparation
- DP-700 Study Guide 2026: Complete Exam Preparation
- DP-600 vs DP-700 vs DP-800: Which Certification is Right for You?
Microsoft Fabric Curriculum progression
Continue your progression through the structured topical learning path:
Want to become a Microsoft Fabric Architect?
Start here to scale your data engineering career with our certification resources and mentorship paths.